CCSS.
Standard Cluster
Represent and interpret data.
Common Core State Standards for Mathematics
Cluster contents
Standards in This Cluster
CCSS.Math.Content.3.MD.B is a cluster heading. These are the individual standards under it.
- CCSS.Math.Content.3.MD.B.3
Draw a scaled picture graph and a scaled bar graph to represent a data set with several categories. Solve one- and two-step "how many more" and "how many less" ...
- CCSS.Math.Content.3.MD.B.4
Generate measurement data by measuring lengths using rulers marked with halves and fourths of an inch. Show the data by making a line plot, where the horizontal...
Teacher's field guide
What This Cluster Means
What Students Need to Do
- Students organize category data in scaled picture graphs and bar graphs. They measure lengths to the nearest half or quarter inch, make line plots, and answer comparison and total questions from graphs.
What Mastery Looks Like
- Students make accurate scaled bar graphs, picture graphs, and line plots from given data. They use graph values to answer one-step and two-step questions, explain comparisons, and identify common or unusual results.
Common Misconceptions
- Students often count each picture or bar unit as one and ignore the graph's scale. They may space fractional lengths unevenly on a line plot or place marks between values. Some compare categories by naming each total instead of finding the difference.
How to Assess It
- Give students a scaled bar graph where each square represents 2 votes and a line plot of six pencil lengths. Ask for one category total, one difference, and the most common pencil length.
Lesson moves
Ways to Teach It
Measure eight classroom objects to the nearest quarter inch, record the lengths, and build a class line plot with sticky notes.
Show a scaled bar graph and ask, "How can you prove which category has six more responses?"
Play Graph Detective by giving pairs clue cards that require totals, differences, and two-step calculations from a posted graph.
Survey classmates about travel to school, make a graph with a scale of two, and write two questions for another group.
Free download
Printable 3.MD.B Worksheet
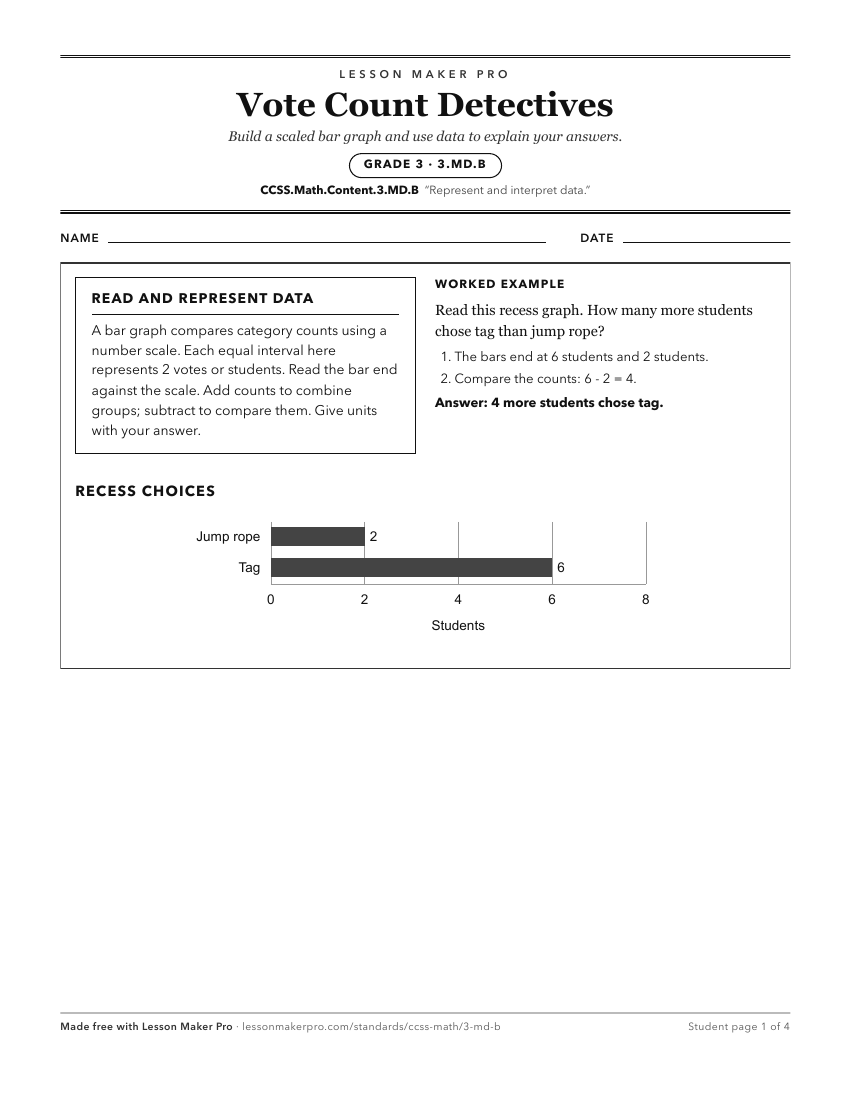
A ready-to-print activity worksheet aligned to CCSS.Math.Content.3.MD.B, with an answer key for the teacher on its own page. No account needed.
PDF, US Letter, prints cleanly in black and white.
Download the worksheetKeep exploring
Related Standards
Turn this cluster into a lesson
Grade, subject, topic, and the complete cluster are prefilled. Create one free, no account needed.
Also for this cluster:Make a WorksheetMake a QuizMake a Sub Lesson