CCSS.
The Standard
Draw a scaled picture graph and a scaled bar graph to represent a data set with several categories. Solve one- and two-step "how many more" and "how many less" problems using information presented in scaled bar graphs.
Common Core State Standards for Mathematics · Measurement and Data
Teacher's field guide
What This Standard Means
What Students Need to Do
- Students organize category totals in picture graphs and bar graphs that use a scale greater than one. They read the scale to compare categories and solve problems that require one or two calculations.
What Mastery Looks Like
- A student can turn a data table into a graph with a clear title, labels, equal intervals, and an accurate key. They can use the graph to solve one-step and two-step comparison problems.
Common Misconceptions
- Students may count symbols or bar sections as one item each and ignore the key. They may use uneven bar widths, skip equal intervals, or subtract categories in the wrong order.
How to Assess It
- Give these totals: cats 15, dogs 30, fish 10. Students draw a graph using intervals of five, then compare dogs with cats and dogs with cats plus fish.
Lesson moves
Ways to Teach It
Survey classmates about four recess choices, build bars with linking cubes where one cube equals two votes, then copy the model onto paper.
Show a graph with one icon worth five votes and ask, “How can you prove Category A has 15 more than Category C?”
Play Graph Detective: pairs draw question cards, solve from a scaled graph, and earn a point only after explaining the scale.
Use cafeteria choice totals to make a bar graph with a scale of five, then decide how many extra servings each option needs.
Free download
Printable 3.MD.B.3 Worksheet
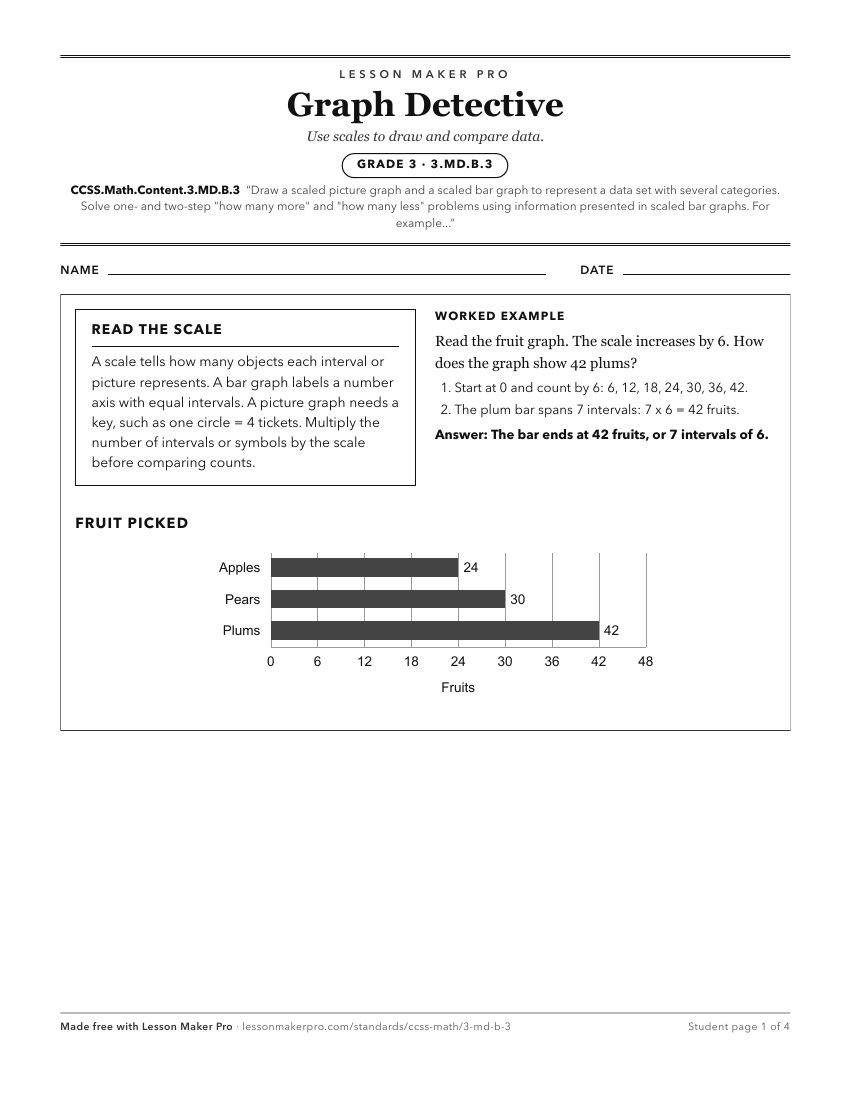
A ready-to-print activity worksheet aligned to CCSS.Math.Content.3.MD.B.3, with an answer key for the teacher on its own page. No account needed.
PDF, US Letter, prints cleanly in black and white.
Download the worksheetLearning progression
Where This Standard Sits
See the whole path on the Measurement & Data progression map.
Before This Standard
If students are struggling here, check these first.
- CCSS.Math.Content.2.OA.A.1
Solving compare word problems with addition and subtraction supports answering how many more or less from graph data.
- CCSS.Math.Content.2.MD.D.10
Students must read, draw, and compare with single-unit graphs before using scaled units and two-step graph comparisons.
- CCSS.Math.Content.2.NBT.A.2
Skip-counting helps students read and label scaled graph intervals, especially when bar graph scales use 5s, 10s, or 100s.
Keep exploring
Related Standards
- CCSS.Math.Content.1.MD.C.4
Organize, represent, and interpret data with up to three categories; ask and answer questions about the total number of data points, how many in each category, ...
- CCSS.Math.Content.5.MD.B.2
Make a line plot to display a data set of measurements in fractions of a unit (1/2, 1/4, 1/8). Use operations on fractions for this grade to solve problems invo...
- CCSS.Math.Content.4.MD.B.4
Make a line plot to display a data set of measurements in fractions of a unit (1/2, 1/4, 1/8). Solve problems involving addition and subtraction of fractions by...
Turn this exact standard into a lesson
Grade, subject, topic, and the complete standard are prefilled. Create one free, no account needed.
Also for this standard:Make a WorksheetMake a QuizMake a Sub Lesson