CCSS.
The Standard
Draw a picture graph and a bar graph (with single-unit scale) to represent a data set with up to four categories. Solve simple put-together, take-apart, and compare problems using information presented in a bar graph.
Common Core State Standards for Mathematics · Measurement and Data
Teacher's field guide
What This Standard Means
What Students Need to Do
- Students organize a small data set into no more than four groups and show the counts with pictures or bars. Each picture and each numbered step represents one item. They use the graph to find totals, differences, and missing parts.
What Mastery Looks Like
- Given a tally table, a student independently makes both graph types with a title, clear labels, and accurate counts. The bar graph begins at zero and increases by ones. The student answers addition, subtraction, and comparison questions using the graph.
Common Misconceptions
- Students may let one picture stand for several items, skip numbers on the scale, or start a bar above zero. They may count grid lines instead of spaces or draw bars with unequal widths. When comparing groups, they often give the larger count instead of finding the difference.
How to Assess It
- Exit ticket: Use these fruit votes: apples 6, bananas 4, grapes 3, oranges 5. Draw both graph types, then find the apples and bananas total and how many more students chose apples than grapes.
Lesson moves
Ways to Teach It
Survey favorite recess activities, place sticky notes in four labeled columns, then transfer the results to picture and bar graphs.
Show two graphs of the same data and ask, “How do you know both graphs tell the same story?”
Play Graph Detective as partners draw cards asking for totals, differences, or missing parts and answer from a posted graph.
Graph cafeteria fruit choices and decide how many more pieces of the most popular fruit should be ordered.
Free download
Printable 2.MD.D.10 Worksheet
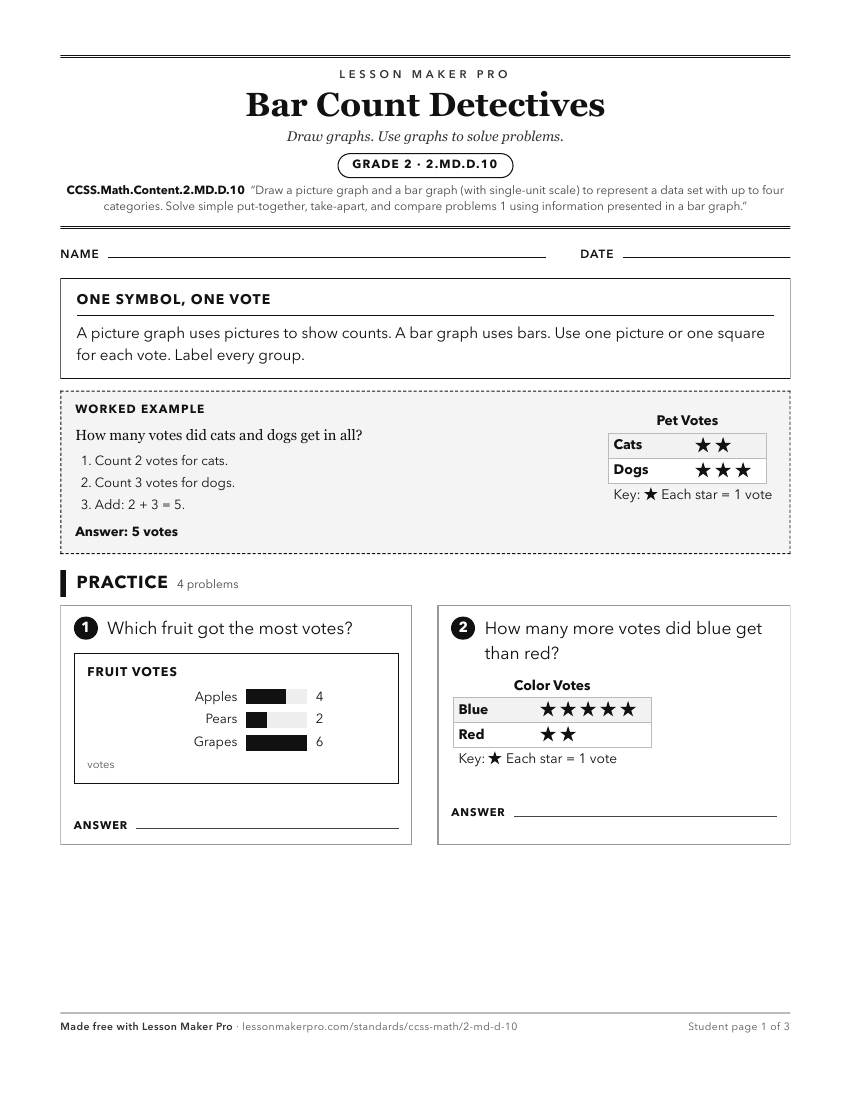
A ready-to-print activity worksheet aligned to CCSS.Math.Content.2.MD.D.10, with an answer key for the teacher on its own page. No account needed.
PDF, US Letter, prints cleanly in black and white.
Download the worksheetLearning progression
Where This Standard Sits
See the whole path on the Measurement & Data progression map.
Before This Standard
If students are struggling here, check these first.
- CCSS.Math.Content.1.OA.A.1
Solving graph questions uses the same put-together, take-apart, and compare addition and subtraction situations in a new data display context.
- CCSS.Math.Content.1.MD.C.4
Students extend organizing and comparing categorical data to drawing picture and bar graphs with more categories.
- CCSS.Math.Content.K.MD.B.3
Classifying objects, counting categories, and comparing counts support representing categorical data in picture and bar graphs.
What This Unlocks
Mastery here sets students up for these next.
Keep exploring
Related Standards
- CCSS.Math.Content.5.MD.B.2
Make a line plot to display a data set of measurements in fractions of a unit (1/2, 1/4, 1/8). Use operations on fractions for this grade to solve problems invo...
- CCSS.Math.Content.4.MD.B.4
Make a line plot to display a data set of measurements in fractions of a unit (1/2, 1/4, 1/8). Solve problems involving addition and subtraction of fractions by...
Turn this exact standard into a lesson
Grade, subject, topic, and the complete standard are prefilled. Create one free, no account needed.
Also for this standard:Make a WorksheetMake a QuizMake a Sub Lesson