CCSS.
The Standard
Informally assess the fit of a function by plotting and analyzing residuals.
Common Core State Standards for Mathematics · Summarize, represent, and interpret data on two categorical and quantitative variables
Teacher's field guide
What This Standard Means
What Students Need to Do
- Students find the difference between each observed value and the value predicted by a function. They plot those residuals and inspect the graph for random scatter or clear patterns.
What Mastery Looks Like
- Students correctly calculate and plot residuals against the explanatory variable. They identify random scatter around zero as evidence of reasonable fit and explain why a visible pattern suggests poor fit.
Common Misconceptions
- Students may subtract in the wrong order, using predicted minus observed instead of observed minus predicted. They may think small residuals alone prove a good fit, ignoring curves, clusters, or changing spread.
How to Assess It
- Give students a scatterplot, a fitted function, and six residuals to plot. Ask: Is the function a reasonable fit, and what feature supports your answer?
Lesson moves
Ways to Teach It
Have pairs calculate residuals from data cards, then place sticky notes on a large residual plot taped to the wall.
Show two residual plots and ask students to write which model fits better, citing zero balance, patterns, and spread.
Play Model Match by having teams pair scatterplots with residual plots and justify each match for one point.
Use temperature and electricity-use data to fit a model, plot residuals, and decide when weather alone fails to explain usage.
Free download
Printable HSS-ID.B.6b Worksheet
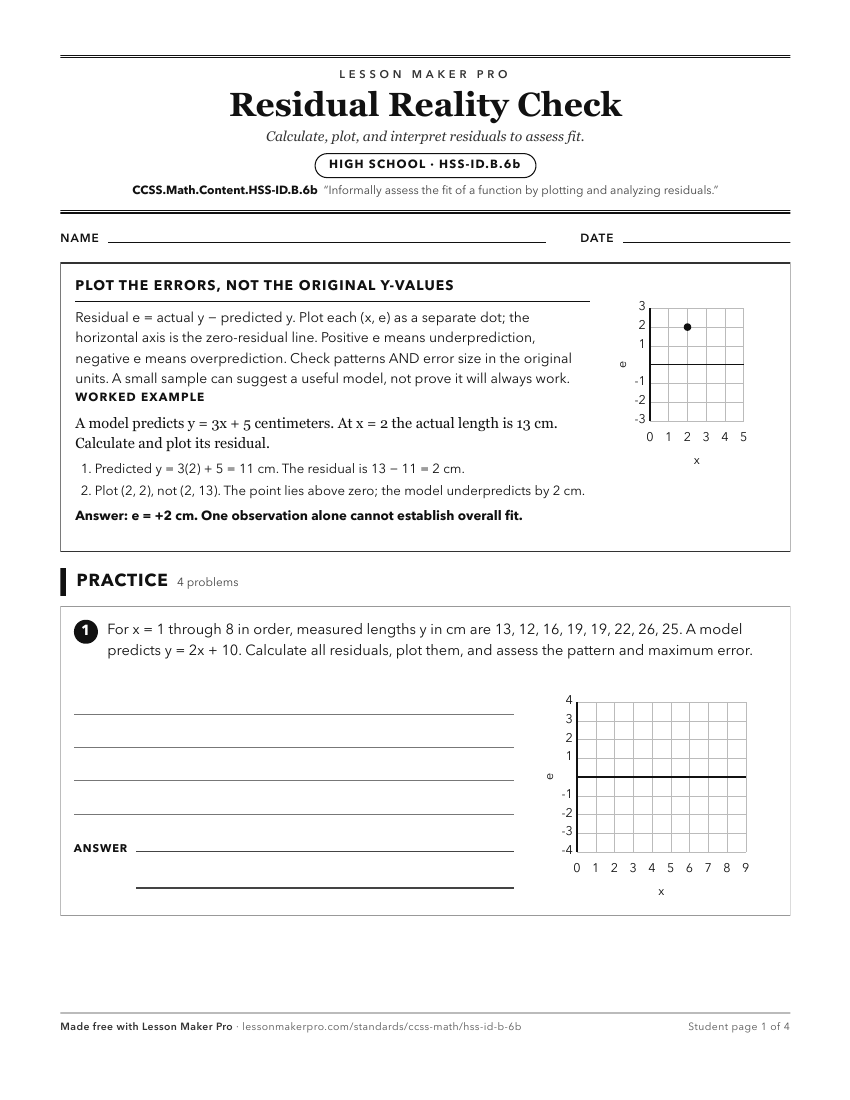
A ready-to-print activity worksheet aligned to CCSS.Math.Content.HSS-ID.B.6b, with an answer key for the teacher on its own page. No account needed.
PDF, US Letter, prints cleanly in black and white.
Download the worksheetLearning progression
Where This Standard Sits
Before This Standard
If students are struggling here, check these first.
- CCSS.Math.Content.HSS-ID.B.6
Residual plots use the same two-variable data and require understanding scatter plots and how a fitted function relates to the data.
- CCSS.Math.Content.HSS-ID.B.6a
Residuals compare observed values to a fitted function’s predictions, so students must first fit and use a model.
- CCSS.Math.Content.HSF-IF.A.2
Residual analysis uses evaluating a fitted function at each input and interpreting the predicted values against observed data.
Keep exploring
Related Standards
Turn this exact standard into a lesson
Grade, subject, topic, and the complete standard are prefilled. Create one free, no account needed.
Also for this standard:Make a WorksheetMake a QuizMake a Sub Lesson