CCSS.
The Standard
Fit a function to the data; use functions fitted to data to solve problems in the context of the data.
Common Core State Standards for Mathematics · Summarize, represent, and interpret data on two categorical and quantitative variables
Teacher's field guide
What This Standard Means
What Students Need to Do
- Students examine paired numerical data and choose a linear, quadratic, or exponential function that fits the pattern. They use the model to estimate values and answer questions in context. They also judge whether the model and its predictions are reasonable.
What Mastery Looks Like
- Students choose a linear, quadratic, or exponential model that matches a data pattern and context. They use the fitted equation to make a prediction and explain what the result means. They recognize when a prediction extends too far beyond the data.
Common Misconceptions
- Students may confuse constant differences with constant ratios when choosing between linear and exponential models. They may expect every data point to lie exactly on the fitted curve. They may also trust predictions far beyond the observed data without considering whether the pattern will continue.
How to Assess It
- Exit ticket: A culture has 100, 150, 225, and 338 cells at hours 0 through 3. Fit a model, predict hour 5, and justify your model choice.
Lesson moves
Ways to Teach It
Drop a ball from a fixed height, record each bounce height, then fit an exponential model and predict the fifth bounce.
Compare two fitted models for the same data and write which model is better, using the graph, residuals, and context as evidence.
Run a card sort matching data tables, scatter plots, equations, and labels for linear, quadratic, or exponential models.
Use used car price data to fit a depreciation model, then estimate the car’s value after five years.
Free download
Printable HSS-ID.B.6a Worksheet
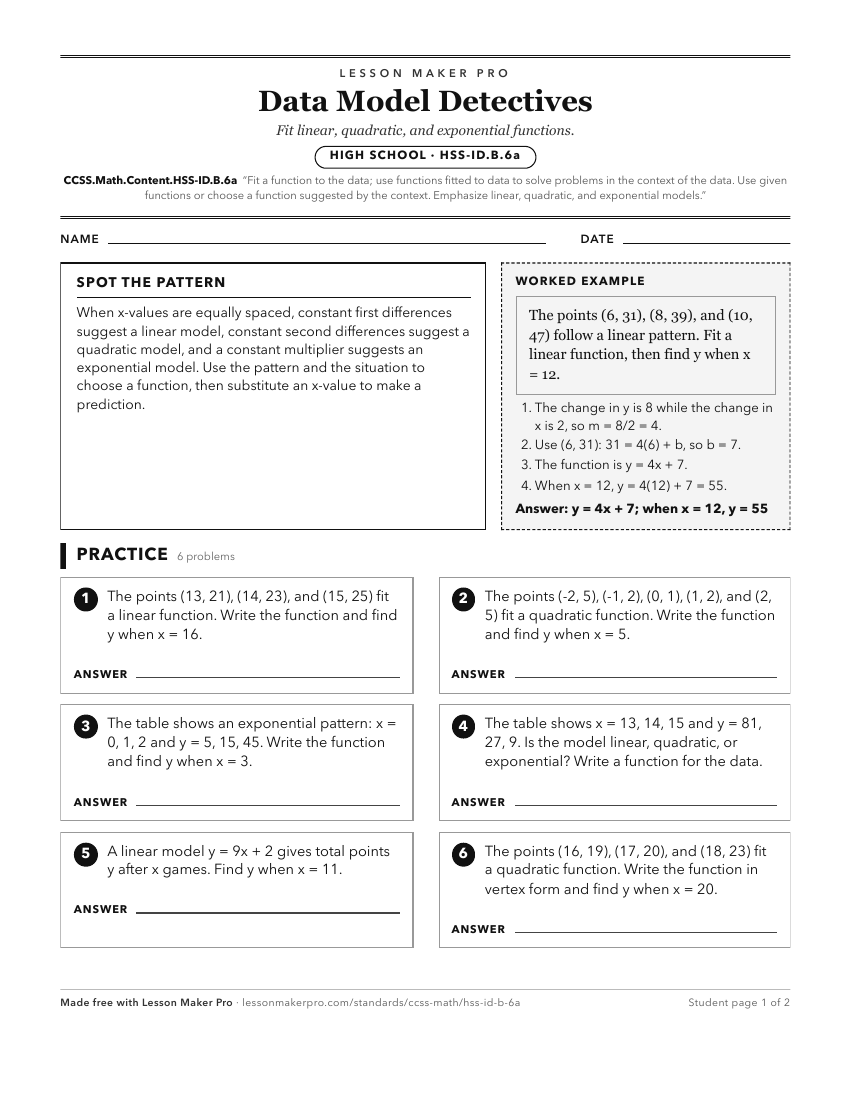
A ready-to-print activity worksheet aligned to CCSS.Math.Content.HSS-ID.B.6a, with an answer key for the teacher on its own page. No account needed.
PDF, US Letter, prints cleanly in black and white.
Download the worksheetLearning progression
Where This Standard Sits
Before This Standard
If students are struggling here, check these first.
- CCSS.Math.Content.8.SP.A.3
Using linear models to interpret and solve contextual data problems supports fitting broader functions to data in high school.
- CCSS.Math.Content.8.SP.A.2
Informally fitting and judging linear models prepares students to fit functions to data and use them for contextual predictions.
- CCSS.Math.Content.HSS-ID.B.6
Scatter plots and describing association prepare students to choose and interpret a fitted function for two-variable data.
What This Unlocks
Mastery here sets students up for these next.
Keep exploring
Related Standards
- CCSS.Math.Content.HSF-IF.A.2
Use function notation, evaluate functions for inputs in their domains, and interpret statements that use function notation in terms of a context.
- CCSS.Math.Content.HSS-ID.C.8
Compute (using technology) and interpret the correlation coefficient of a linear fit.
- CCSS.Math.Content.8.F.A
Define, evaluate, and compare functions.
Turn this exact standard into a lesson
Grade, subject, topic, and the complete standard are prefilled. Create one free, no account needed.
Also for this standard:Make a WorksheetMake a QuizMake a Sub Lesson