CCSS.
The Standard
Compute (using technology) and interpret the correlation coefficient of a linear fit.
Common Core State Standards for Mathematics
Teacher's field guide
What This Standard Means
What Students Need to Do
- Students use a calculator, spreadsheet, or statistics tool to compute the correlation coefficient for paired quantitative data. They explain whether the linear association is positive or negative, and weak or strong.
What Mastery Looks Like
- Students enter paired data correctly and obtain the correlation coefficient with a calculator or spreadsheet. They interpret the sign and distance from zero, using the variables and context in their explanation.
Common Misconceptions
- Students may confuse correlation with slope or think a larger positive value means a steeper line. They may say correlation proves causation. They may also assume a value near zero means no relationship, rather than no linear relationship.
How to Assess It
- Give students paired data with a scatterplot and ask them to use technology to find r, then describe its direction and strength in context.
Lesson moves
Ways to Teach It
Have students measure classmates’ heights and arm spans, enter the pairs in a spreadsheet, calculate r, and interpret the result.
Show two scatterplots with similar slopes but different correlations, then ask students to explain why the r-values differ.
Run a matching game where students pair scatterplots, correlation coefficients, and written descriptions of direction and strength.
Use local temperature and electricity-use data to calculate correlation, then discuss why the result does not prove that one variable causes the other.
Free download
Printable HSS-ID.C.8 Worksheet
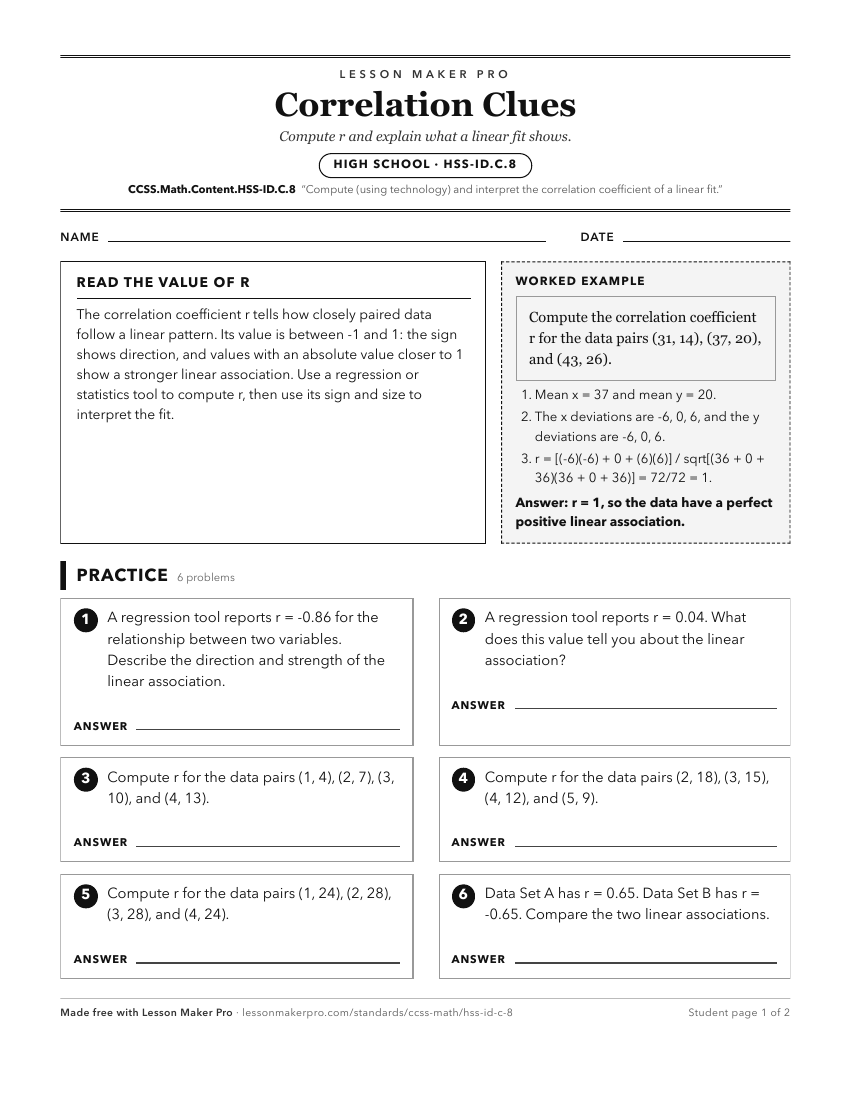
A ready-to-print activity worksheet aligned to CCSS.Math.Content.HSS-ID.C.8, with an answer key for the teacher on its own page. No account needed.
PDF, US Letter, prints cleanly in black and white.
Download the worksheetLearning progression
Where This Standard Sits
Before This Standard
If students are struggling here, check these first.
- CCSS.Math.Content.HSS-ID.B.6
Scatter plots and describing linear association prepare students to interpret what the correlation coefficient says about direction and strength.
- CCSS.Math.Content.8.SP.A.2
Informal judging of linear fit and point closeness prepares students to interpret correlation as strength and direction of linear association.
- CCSS.Math.Content.HSS-ID.B.6c
Choosing a linear model for a scatter plot supports interpreting correlation as the strength and direction of that linear relationship.
What This Unlocks
Mastery here sets students up for these next.
Keep exploring
Related Standards
- CCSS.Math.Content.8.SP.A.3
Use the equation of a linear model to solve problems in the context of bivariate measurement data, interpreting the slope and intercept.
- CCSS.Math.Content.6.EE.C
Represent and analyze quantitative relationships between dependent and independent variables.
- CCSS.Math.Content.HSS-ID.C
Interpret linear models
Turn this exact standard into a lesson
Grade, subject, topic, and the complete standard are prefilled. Create one free, no account needed.
Also for this standard:Make a WorksheetMake a QuizMake a Sub Lesson