CCSS.
The Standard
Summarize categorical data for two categories in two-way frequency tables. Interpret relative frequencies in the context of the data (including joint, marginal, and conditional relative frequencies). Recognize possible associations and trends in the data.
Common Core State Standards for Mathematics
Teacher's field guide
What This Standard Means
What Students Need to Do
- Students organize counts for two categorical variables in a two-way table. They calculate and interpret joint, marginal, and conditional percentages, then use comparisons to identify possible associations.
What Mastery Looks Like
- Students accurately calculate cell, row, column, and conditional percentages using the correct denominator. They compare conditional percentages and explain any apparent association in the context of the data.
Common Misconceptions
- Students often divide by the grand total when a row or column total is required. They may confuse joint, marginal, and conditional percentages. They may also claim that an association proves one variable causes the other.
How to Assess It
- Give students this table: bus riders, 24 bring lunch and 16 buy lunch; nonriders, 18 bring lunch and 42 buy lunch. Ask them to find one joint, one marginal, and two conditional relative frequencies, then state whether transportation and lunch choice appear associated.
Lesson moves
Ways to Teach It
Have students place sticky notes on a four-cell poster for pet ownership and sibling status, then calculate cell, row, and column percentages.
Ask, “Does club membership appear related to attendance?” Students cite two conditional percentages from a provided table in a three-sentence response.
Give pairs data cards showing two traits; they sort, build a table, and earn points for correct frequency interpretations.
Use school survey data on transportation and tardiness to decide whether bus riders and car riders show different tardiness rates.
Free download
Printable HSS-ID.B.5 Worksheet
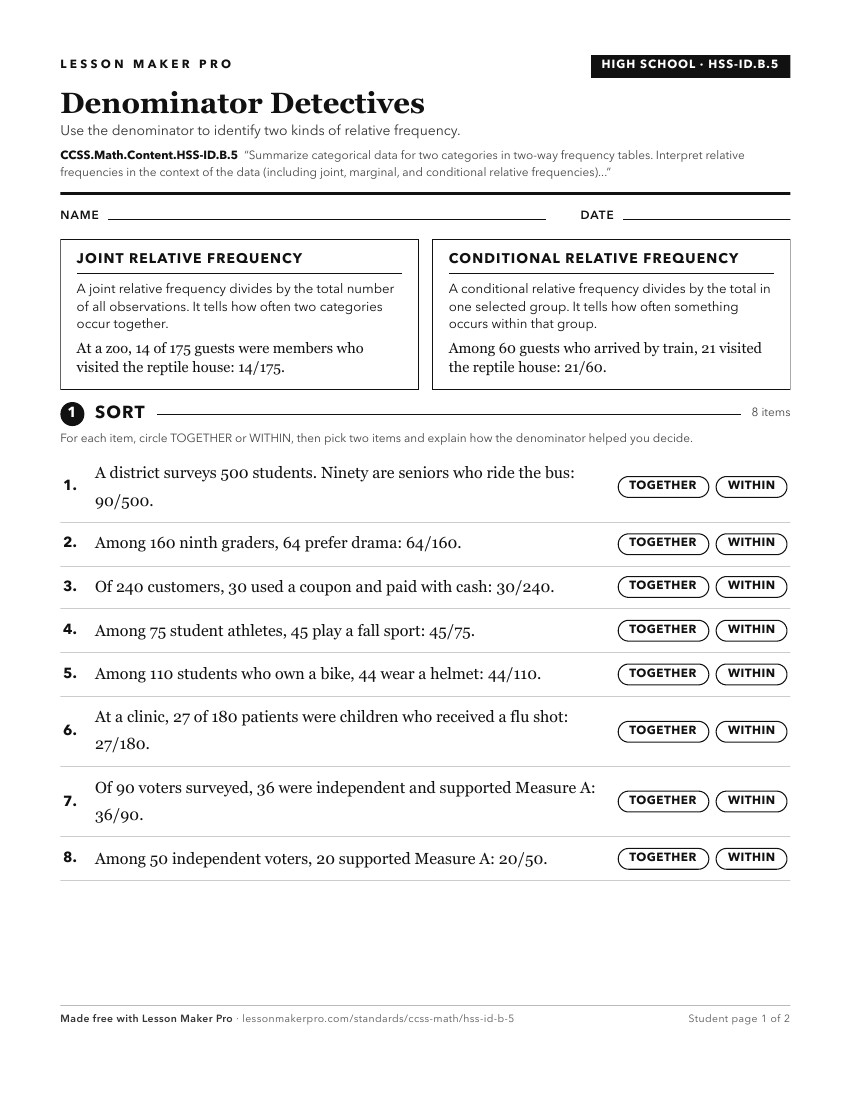
A ready-to-print activity worksheet aligned to CCSS.Math.Content.HSS-ID.B.5, with an answer key for the teacher on its own page. No account needed.
PDF, US Letter, prints cleanly in black and white.
Download the worksheetLearning progression
Where This Standard Sits
Before This Standard
If students are struggling here, check these first.
- CCSS.Math.Content.8.SP.A.4
High school work extends two-way tables from row and column relative frequencies to joint, marginal, and conditional interpretations.
- CCSS.Math.Content.7.RP.A.3
Percent and ratio reasoning support computing and comparing joint, marginal, and conditional relative frequencies in two-way tables.
Keep exploring
Related Standards
- CCSS.Math.Content.1.MD.C.4
Organize, represent, and interpret data with up to three categories; ask and answer questions about the total number of data points, how many in each category, ...
- CCSS.Math.Content.HSS-CP.A.4
Construct and interpret two-way frequency tables of data when two categories are associated with each object being classified. Use the two-way table as a sample...
- CCSS.Math.Content.HSS-ID.B
Summarize, represent, and interpret data on two categorical and quantitative variables
Turn this exact standard into a lesson
Grade, subject, topic, and the complete standard are prefilled. Create one free, no account needed.
Also for this standard:Make a WorksheetMake a QuizMake a Sub Lesson