CCSS.
The Standard
Distinguish between correlation and causation.
Common Core State Standards for Mathematics
Teacher's field guide
What This Standard Means
What Students Need to Do
- Students identify when two variables change together and decide whether the evidence supports a cause-and-effect claim. They explain how study design, reverse cause, or lurking variables affect that decision.
What Mastery Looks Like
- Given a graph or study summary, students can state whether it shows association or supports a cause-and-effect claim. They justify the decision using study design, random assignment, and possible lurking variables.
Common Misconceptions
- Students may assume a strong association proves that one variable causes the other. They often miss reverse cause and lurking variables, such as weather affecting both swimming and ice cream sales.
How to Assess It
- Exit ticket: A survey finds that students who sleep more earn higher grades. Can the survey prove that sleep raises grades, and what other variable might explain the result?
Lesson moves
Ways to Teach It
Give pairs study-summary cards to sort into association only, possible cause, or insufficient evidence, then require one reason for each choice.
Discuss this prompt: If shoe size and reading skill rise together in children, does larger footwear improve reading, or is age involved?
Play Claim Detective, where teams earn points by spotting reverse cause, lurking variables, or missing random assignment in short scenarios.
Have students find a causal claim in a news headline and check whether the linked study used observation or random assignment.
Free download
Printable HSS-ID.C.9 Worksheet
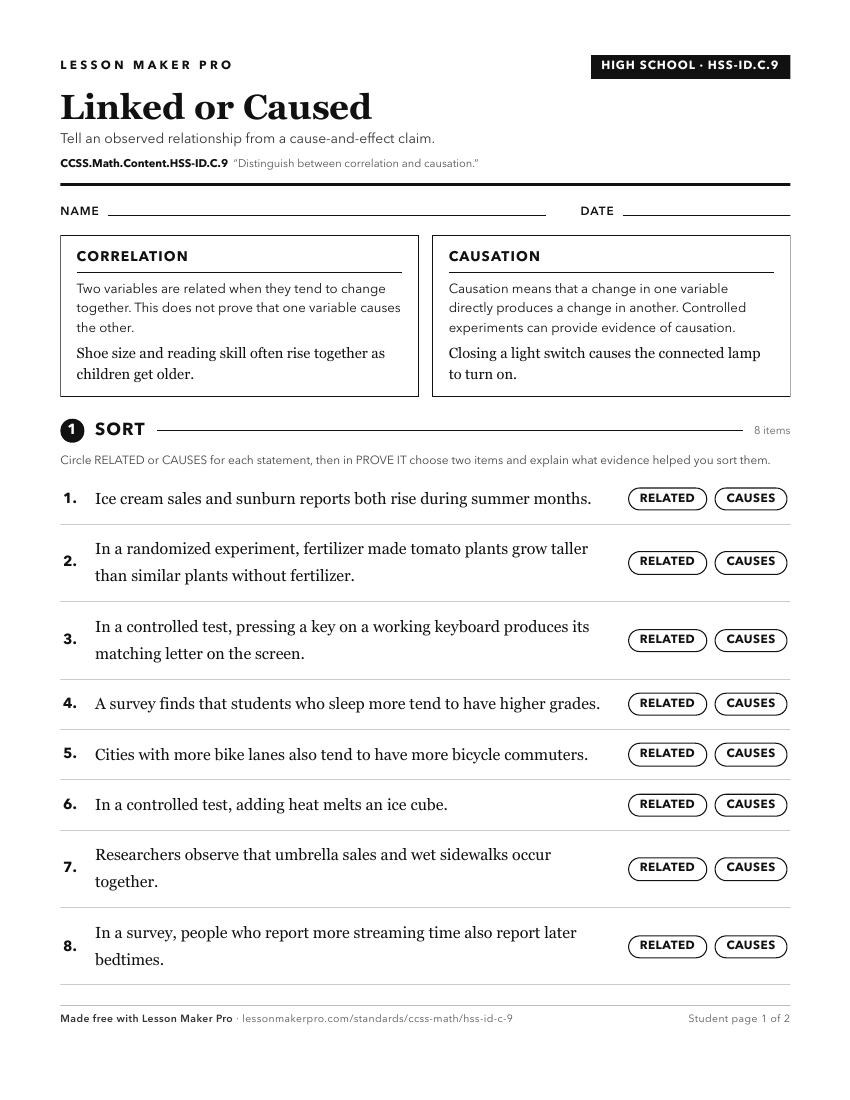
A ready-to-print activity worksheet aligned to CCSS.Math.Content.HSS-ID.C.9, with an answer key for the teacher on its own page. No account needed.
PDF, US Letter, prints cleanly in black and white.
Download the worksheetLearning progression
Where This Standard Sits
Before This Standard
If students are struggling here, check these first.
- CCSS.Math.Content.HSS-ID.B.6
Reading scatter plots and describing association gives students the correlation idea they must separate from causal claims.
- CCSS.Math.Content.HSS-ID.C.8
Interpreting a correlation coefficient gives students concrete experience with association before deciding whether an association justifies causal claims.
What This Unlocks
Mastery here sets students up for these next.
- CCSS.Math.Content.HSS-IC.B.6
Recognizing when data show association rather than cause helps students judge whether a report’s conclusions overstate the evidence.
- CCSS.Math.Content.HSS-IC.B.3
Knowing correlation is not causation helps students distinguish observational studies from experiments and understand why random assignment supports causal claims.
Keep exploring
Related Standards
- CCSS.Math.Content.6.EE.C
Represent and analyze quantitative relationships between dependent and independent variables.
- CCSS.Math.Content.8.SP.A
Investigate patterns of association in bivariate data.
- CCSS.Math.Content.K.MD.A.2
Directly compare two objects with a measurable attribute in common, to see which object has "more of"/"less of" the attribute, and describe the difference.
Turn this exact standard into a lesson
Grade, subject, topic, and the complete standard are prefilled. Create one free, no account needed.
Also for this standard:Make a WorksheetMake a QuizMake a Sub Lesson