Alabama Math MM.D3D.C
Standard Cluster
Statistical studies allow a conclusion to be drawn about a population that is too large to survey completely or about cause and effect in an experiment.
2019 Alabama Course of Study: Mathematics · Mathematical Modeling
Cluster contents
Standards in This Cluster
MM.D3D.C is a cluster heading. These are the individual standards under it.
- MM.D3D.C.17
Use the Statistical Problem Solving Cycle to answer real-world questions.
- MM.D3D.C.18
Construct a probability distribution based on empirical observations of a variable.
- MM.D3D.C.18.a
Estimate the probability of each value for a random variable based on empirical observations or simulations, using technology.
- MM.D3D.C.18.b
Represent a probability distribution by a relative frequency histogram and/or a cumulative relative frequency graph.
- MM.D3D.C.18.c
Find the mean, standard deviation, median, and interquartile range of a probability distribution and make long-term predictions about future possibilities. Dete...
- MM.D3D.C.19
Construct a sampling distribution for a random event or random sample.
- MM.D3D.C.19.a
Use the binomial theorem to construct the sampling distribution for the number of successes in a binary event or the number of positive responses to a yes/no qu...
- MM.D3D.C.19.b
Use the normal approximation of a proportion from a random event or sample when conditions are met.
- MM.D3D.C.19.c
Use the central limit theorem to construct a normal sampling distribution for the sample mean when conditions are met.
- MM.D3D.C.19.d
Find the long-term probability of a given range of outcomes from a random event or random sample.
- MM.D3D.C.20
Perform inference procedures based on the results of samples and experiments.
- MM.D3D.C.20.a
Use a point estimator and margin of error to construct a confidence interval for a proportion or mean.
- MM.D3D.C.20.b
Interpret a confidence interval in context and use it to make strategic decisions.
- MM.D3D.C.20.c
Perform a significance test for null and alternative hypotheses.
- MM.D3D.C.20.d
Interpret the significance level of a test in the context of error probabilities, and use the results to make strategic decisions.
- MM.D3D.C.21
Critique the validity of reported conclusions from statistical studies in terms of bias and random error probabilities.
- MM.D3D.C.22
Conduct a randomized study on a topic of student interest (sample or experiment) and draw conclusions based upon the results.
Teacher's field guide
What This Cluster Means
What Students Need to Do
- Students decide what conclusions a study supports. They check how people were selected and whether treatments were randomly assigned before making claims about a larger group or cause and effect.
What Mastery Looks Like
- Given a poll, students name the group its results can represent and explain why. Given an experiment, they explain whether the design supports a cause-and-effect claim.
Common Misconceptions
- Students may think a large volunteer poll represents everyone. They may also think a random sample proves cause and effect, or that random treatment assignment makes volunteers representative of a larger population.
How to Assess It
- Ask: 'Researchers randomly assign 60 volunteers to two study methods and compare test scores. Can they claim one method caused a difference? Can they claim it will work for all students? Explain both answers.'
Lesson moves
Ways to Teach It
Put 30 red and 70 blue slips in a bag; groups draw 20 without looking, estimate the red fraction, then compare estimates.
Show a voluntary online poll of 40 students; ask, 'Can it represent the whole school? Why or why not?'
Sort cards showing a random survey, volunteer poll, random treatment assignment, and observed groups by which claims each supports.
Compare a cafeteria customer survey with a claim about every student's favorite lunch; identify who the survey leaves out.
Free download
Printable MM.D3D.C Worksheet
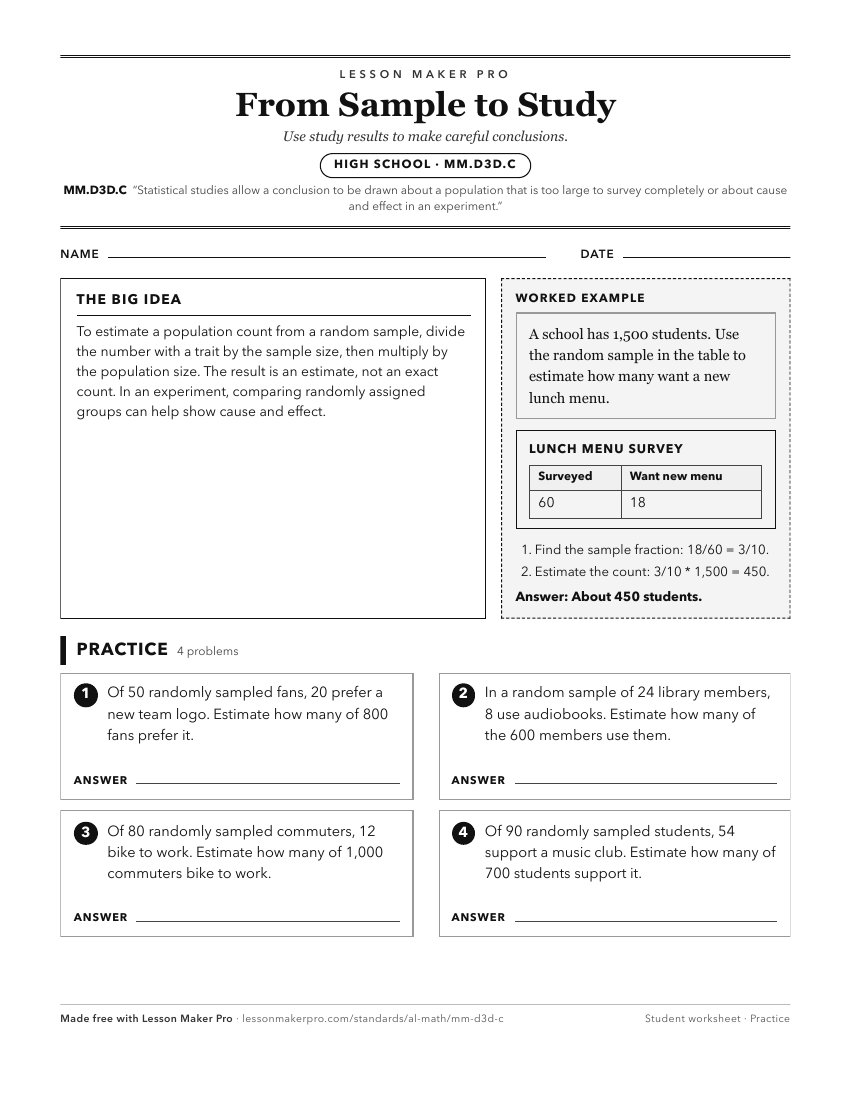
A ready-to-print activity worksheet aligned to MM.D3D.C, with an answer key for the teacher on its own page. No account needed.
PDF, US Letter, prints cleanly in black and white.
Download the worksheetKeep exploring
Related Standards
- 7.DSP.A.10.c
Determine whether conclusions and generalizations can be made about a population based on a sample.
- 7A.DSP.A.26.c
Determine whether conclusions and generalizations can be made about a population based on a sample.
- A2S.DSP.E.28
Describe differences between randomly selecting samples and randomly assigning subjects to experimental treatment groups in terms of inferences drawn regarding ...
- 7.DSP.A.10.d
Use data from a random sample to draw inferences about a population with an unknown characteristic of interest, generating multiple samples to gauge variation a...
Turn this cluster into a lesson
Grade, subject, topic, and the complete cluster are prefilled. Create one free, no account needed.
Also for this cluster:Make a WorksheetMake a QuizMake a Sub Lesson