Alabama Math MM.D3D.C.19.b
The Standard
- MM.D3D.C
- Statistical studies allow a conclusion to be drawn about a population that is too large to survey completely or about cause and effect in an experiment.
- MM.D3D.C.19
- Construct a sampling distribution for a random event or random sample.
Use the normal approximation of a proportion from a random event or sample when conditions are met.
2019 Alabama Course of Study: Mathematics · Statistical studies allow a conclusion to be drawn about a population that is too large to survey completely or about cause and effect in an experiment.
Teacher's field guide
What This Standard Means
What Students Need to Do
- Students check that trials are independent or that a random sample is at most 10% of the population. They check that the expected numbers of successes and failures are each at least 10. Then they use a normal curve to estimate the chance of a sample proportion.
What Mastery Looks Like
- With 100 independent trials and a success chance of 0.30, a student finds 30 expected successes and 70 expected failures. They use a normal curve centered at 0.30, with a spread near 0.046, to estimate the chance that more than 35% succeed. They reject the approximation when a check fails.
Common Misconceptions
- Students may check observed successes and failures instead of expected counts. Some treat responses from friends as a random sample. Others center the curve at the observed proportion or forget to account for sample size when finding its spread.
How to Assess It
- Exit ticket: In a town of 2,000 people, 8% prefer tea; you randomly sample 100. Decide whether a normal curve fits, showing both expected counts and the sample fraction.
Lesson moves
Ways to Teach It
Have pairs flip a coin 40 times, record their heads proportion, and place a sticky note on a class dot plot.
Ask: Why would a 100-person poll with 8% expected support fail the normal check? Have students write two sentences.
Hand pairs four (n, p) cards: (40, .5), (50, .1), (200, .2), (100, .95); sort by whether both expected counts reach 10.
At a 2,000-student school where 30% prefer pizza, estimate the chance at least 35 of 100 randomly sampled students prefer it.
Free download
Printable MM.D3D.C.19.b Worksheet
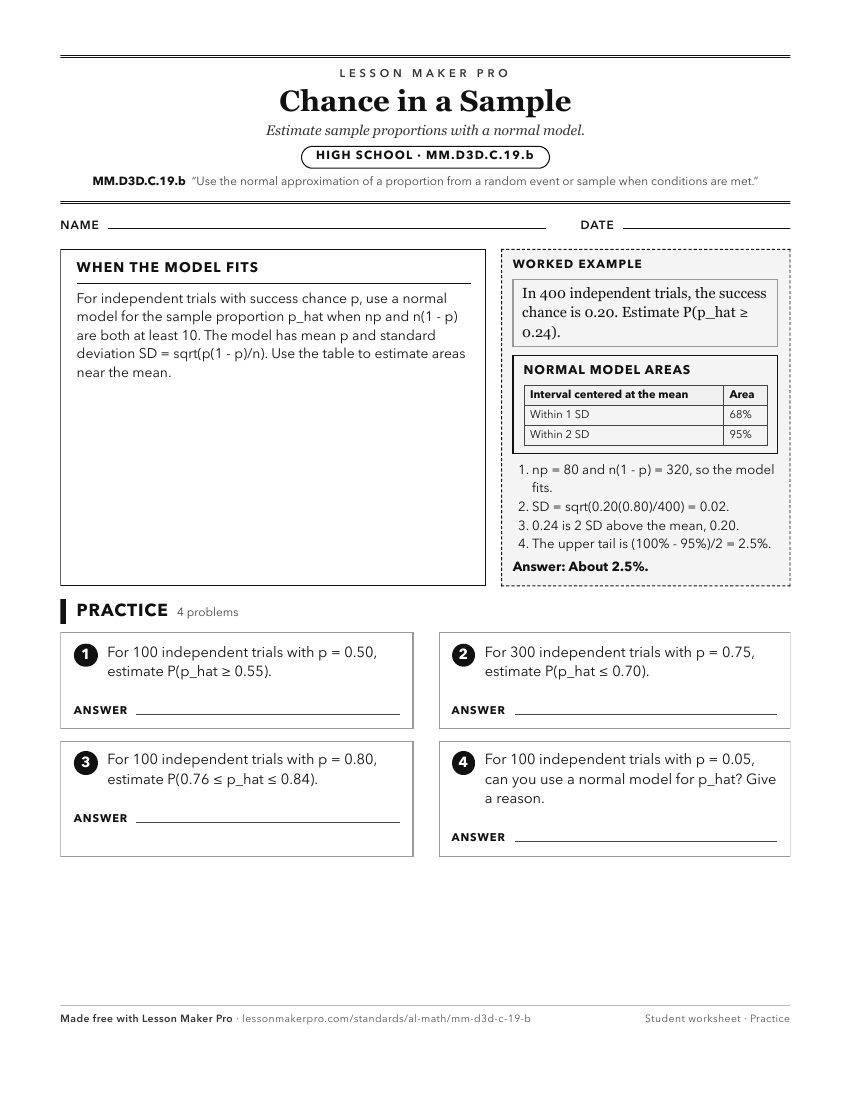
A ready-to-print activity worksheet aligned to MM.D3D.C.19.b, with an answer key for the teacher on its own page. No account needed.
PDF, US Letter, prints cleanly in black and white.
Download the worksheetKeep exploring
Related Standards
- MM.D3D.C.19.c
Use the central limit theorem to construct a normal sampling distribution for the sample mean when conditions are met.
- 7A.DSP.C.31
Approximate the probability of an event by using data generated by a simulation (experimental probability) and compare it to theoretical probability.
- MM.D3D.C.20.a
Use a point estimator and margin of error to construct a confidence interval for a proportion or mean.
- 7.DSP.C.15
Approximate the probability of an event using data generated by a simulation (experimental probability) and compare it to the theoretical probability.
Turn this exact standard into a lesson
Grade, subject, topic, and the complete standard are prefilled. Create one free, no account needed.
Also for this standard:Make a WorksheetMake a QuizMake a Sub Lesson