Alabama Math MM.D3D.C.19.c
The Standard
- MM.D3D.C
- Statistical studies allow a conclusion to be drawn about a population that is too large to survey completely or about cause and effect in an experiment.
- MM.D3D.C.19
- Construct a sampling distribution for a random event or random sample.
Use the central limit theorem to construct a normal sampling distribution for the sample mean when conditions are met.
2019 Alabama Course of Study: Mathematics · Statistical studies allow a conclusion to be drawn about a population that is too large to survey completely or about cause and effect in an experiment.
Teacher's field guide
What This Standard Means
What Students Need to Do
- Students check that samples are independent and that the population is normal or the sample is large enough. They sketch a normal curve for sample means. They center it at the population mean and calculate its spread by dividing the population standard deviation by the square root of the sample size.
What Mastery Looks Like
- For a large, roughly symmetric population with mean 50 and standard deviation 12, students sketch the distribution of means from random samples of 36. They label its center 50 and its standard deviation 2.
Common Misconceptions
- Students may use the population standard deviation as the spread of sample means. Some think the original data become normal, or that a sample of 30 always makes the approximation work, even with severe skew or dependent observations.
How to Assess It
- Exit ticket: A large, roughly symmetric population has mean 50 and standard deviation 12. For random samples of 36, sketch the distribution of sample means, label its center and standard deviation, and say what the curve represents.
Lesson moves
Ways to Teach It
Have pairs roll a die 20 times, calculate their mean, and add it to a class dot plot beside single-roll results.
Ask, "Why do averages of 36 package weights vary less than individual weights from the same factory?"
Give pairs cards with a population mean, standard deviation, and sample size; have them label each sampling curve's center and spread.
For bakery loaves averaging 500 g with a standard deviation of 12 g, have students estimate the spread of averages from random batches of 36.
Free download
Printable MM.D3D.C.19.c Worksheet
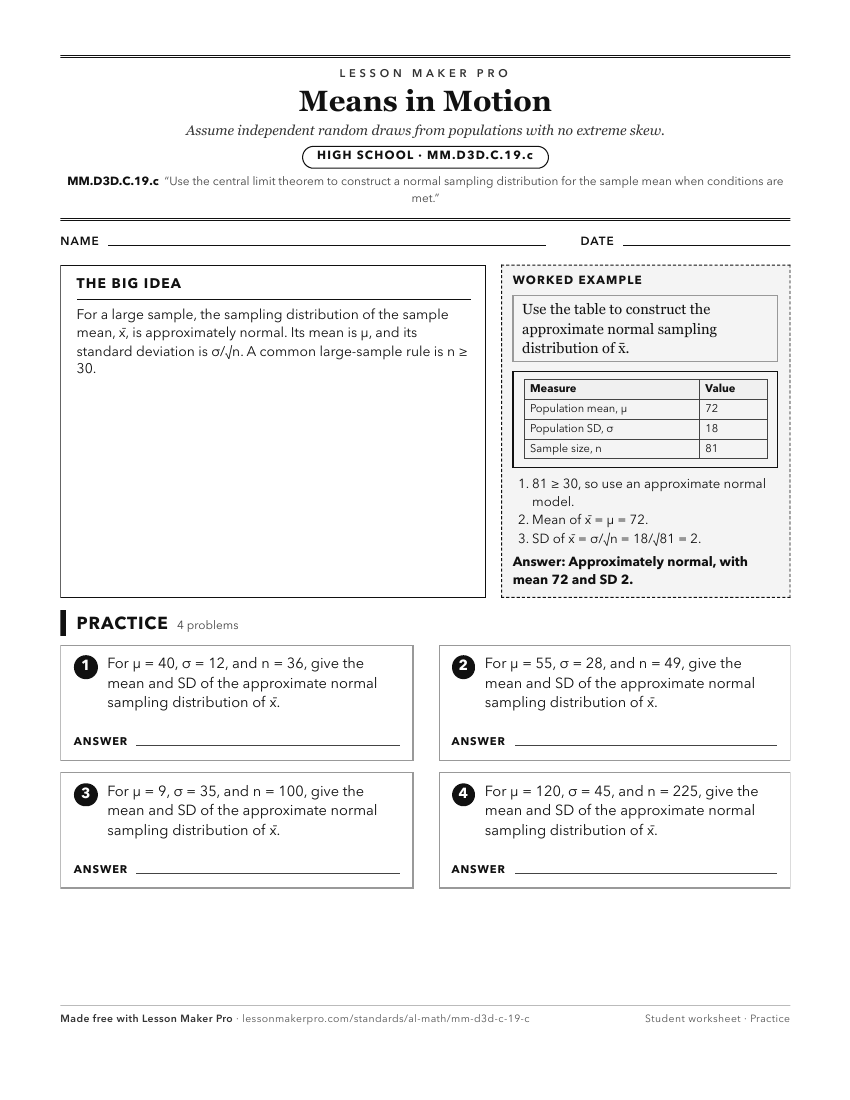
A ready-to-print activity worksheet aligned to MM.D3D.C.19.c, with an answer key for the teacher on its own page. No account needed.
PDF, US Letter, prints cleanly in black and white.
Download the worksheetKeep exploring
Related Standards
- A2S.DSP.I.32.a
Verify that a sampling distribution is centered at the population mean and approximately normal if the sample size is large enough.
- MM.D3D.C.19.b
Use the normal approximation of a proportion from a random event or sample when conditions are met.
- A2S.DSP.C.25
From a normal distribution, use technology to find the mean and standard deviation and estimate population percentages by applying the empirical rule.
- A2S.DSP.I.32.b
Verify that 95% of sample means are within two standard deviations of the sampling distribution from the population mean.
Turn this exact standard into a lesson
Grade, subject, topic, and the complete standard are prefilled. Create one free, no account needed.
Also for this standard:Make a WorksheetMake a QuizMake a Sub Lesson