Alabama Math A2S.DSP.C.25
Standard Cluster
- A2S.DSP.C
- Distributions of quantitative data (continuous or discrete) in one variable should be described in the context of the data with respect to what is typical (the shape, with appropriate measures of center and variability, including standard deviation) and what is not (outliers), and these characteristics can be used to compare two or more subgroups with respect to a variable.
From a normal distribution, use technology to find the mean and standard deviation and estimate population percentages by applying the empirical rule. a. Use technology to determine if a given set of data is normal by applying the empirical rule. b. Estimate areas under a normal curve to solve problems in context, using calculators, spreadsheets, and tables as appropriate.
2019 Alabama Course of Study: Mathematics
Cluster contents
Standards in This Cluster
A2S.DSP.C.25 is a cluster heading. These are the individual standards under it.
Teacher's field guide
What This Cluster Means
What Students Need to Do
- Students use a calculator or spreadsheet to find the mean and standard deviation of a data set. They compare the percentages within one, two, and three standard deviations with 68%, 95%, and 99.7% to judge whether a normal model is reasonable. They use areas under a normal curve to estimate percentages in context.
What Mastery Looks Like
- A student can calculate the mean and standard deviation, count values in each band, and explain whether the counts roughly fit a normal curve. Given a cutoff, they can use a calculator or normal table to estimate the percentage above or below it.
Common Misconceptions
- Students may think 68% of values are above the mean, rather than within one standard deviation of it. They may also mistake the area below a cutoff for the area above it, or assume a data set is normal just because its graph looks roughly bell-shaped.
How to Assess It
- Exit ticket: A data set has mean 70 and standard deviation 5, with 68%, 95%, and 100% of values within one, two, and three standard deviations. Is a normal model reasonable, and about what percentage of values is above 80?
Lesson moves
Ways to Teach It
Pairs use a spreadsheet of 100 simulated heights to calculate AVERAGE and STDEV.S, then compare counts in three standard deviation bands with 68/95/99.7.
Ask: If 68% of heights fall within one standard deviation, why is 68% not the share taller than the mean?
Teams match cutoff cards to shaded normal curve cards, then use normalcdf to check the percentage for each match.
At a bolt factory, assume diameters are normal with mean 10 mm and standard deviation 0.1 mm; calculate the percentage outside 9.8 to 10.2 mm.
Free download
Printable A2S.DSP.C.25 Worksheet
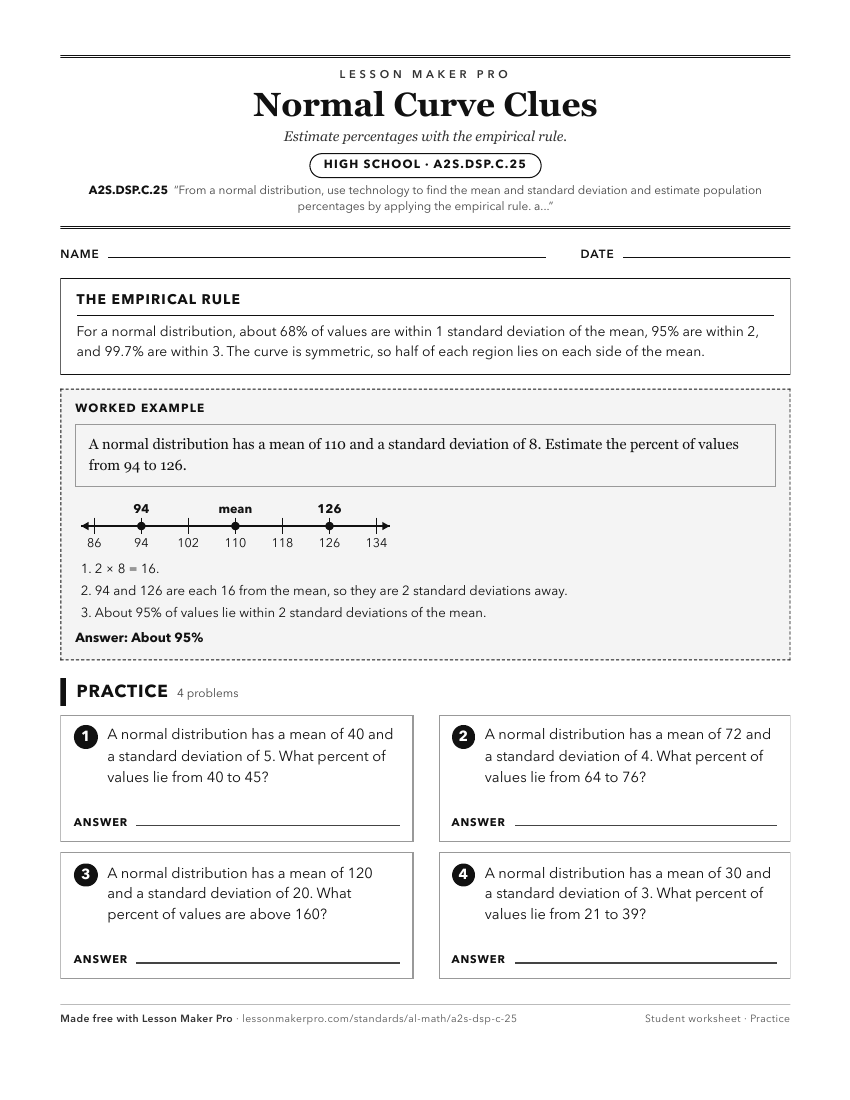
A ready-to-print activity worksheet aligned to A2S.DSP.C.25, with an answer key for the teacher on its own page. No account needed.
PDF, US Letter, prints cleanly in black and white.
Download the worksheetKeep exploring
Related Standards
- MM.D3D.C.18.a
Estimate the probability of each value for a random variable based on empirical observations or simulations, using technology.
- MM.D3D.C.18.c
Find the mean, standard deviation, median, and interquartile range of a probability distribution and make long-term predictions about future possibilities. Dete...
- MM.D3D.C.19.c
Use the central limit theorem to construct a normal sampling distribution for the sample mean when conditions are met.
Turn this cluster into a lesson
Grade, subject, topic, and the complete cluster are prefilled. Create one free, no account needed.
Also for this cluster:Make a WorksheetMake a QuizMake a Sub Lesson