Alabama Math A2S.DSP.C.25.a
The Standard
- A2S.DSP.C
- Distributions of quantitative data (continuous or discrete) in one variable should be described in the context of the data with respect to what is typical (the shape, with appropriate measures of center and variability, including standard deviation) and what is not (outliers), and these characteristics can be used to compare two or more subgroups with respect to a variable.
- A2S.DSP.C.25
- From a normal distribution, use technology to find the mean and standard deviation and estimate population percentages by applying the empirical rule.
Use technology to determine if a given set of data is normal by applying the empirical rule.
2019 Alabama Course of Study: Mathematics · Distributions of quantitative data (continuous or discrete) in one variable should be described in the context of the data with respect to what is typical (the shape, with appropriate measures of center and variability, including standard deviation) and what is not (outliers), and these characteristics can be used to compare two or more subgroups with respect to a variable.
Teacher's field guide
What This Standard Means
What Students Need to Do
- Students use a spreadsheet to find the mean and standard deviation of a data set. They find the percentage of values within one, two, and three standard deviations of the mean. They compare those percentages with 68%, 95%, and 99.7% and check the histogram.
What Mastery Looks Like
- A student can set up the three intervals, count the values in each, and calculate the percentages. They can say whether the results and histogram support an approximately normal model, without claiming the check proves it.
Common Misconceptions
- Students may measure standard deviations from zero instead of from the mean. They may think one matching percentage proves the data are normal. They may also expect the percentages to match the empirical rule exactly in a small sample.
How to Assess It
- For 200 scores, a spreadsheet reports a mean of 50, a standard deviation of 10, and counts of 137, 192, and 199 within one, two, and three standard deviations. Use a calculator to find the percentages, then say whether a normal model seems reasonable and what else you would check.
Lesson moves
Ways to Teach It
Generate 200 values with NORM.INV(RAND(),50,10) in a spreadsheet, make a histogram, and count values within one, two, and three standard deviations.
Show a right-skewed histogram and ask, "Why would three matching interval percentages alone not prove these data are normal?"
Give pairs a spreadsheet of 100 scores and race to find the mean, standard deviation, and percentages in the three intervals.
Download last year's daily high temperatures for your town, graph them in a spreadsheet, and test whether the empirical rule fits.
Free download
Printable A2S.DSP.C.25.a Worksheet
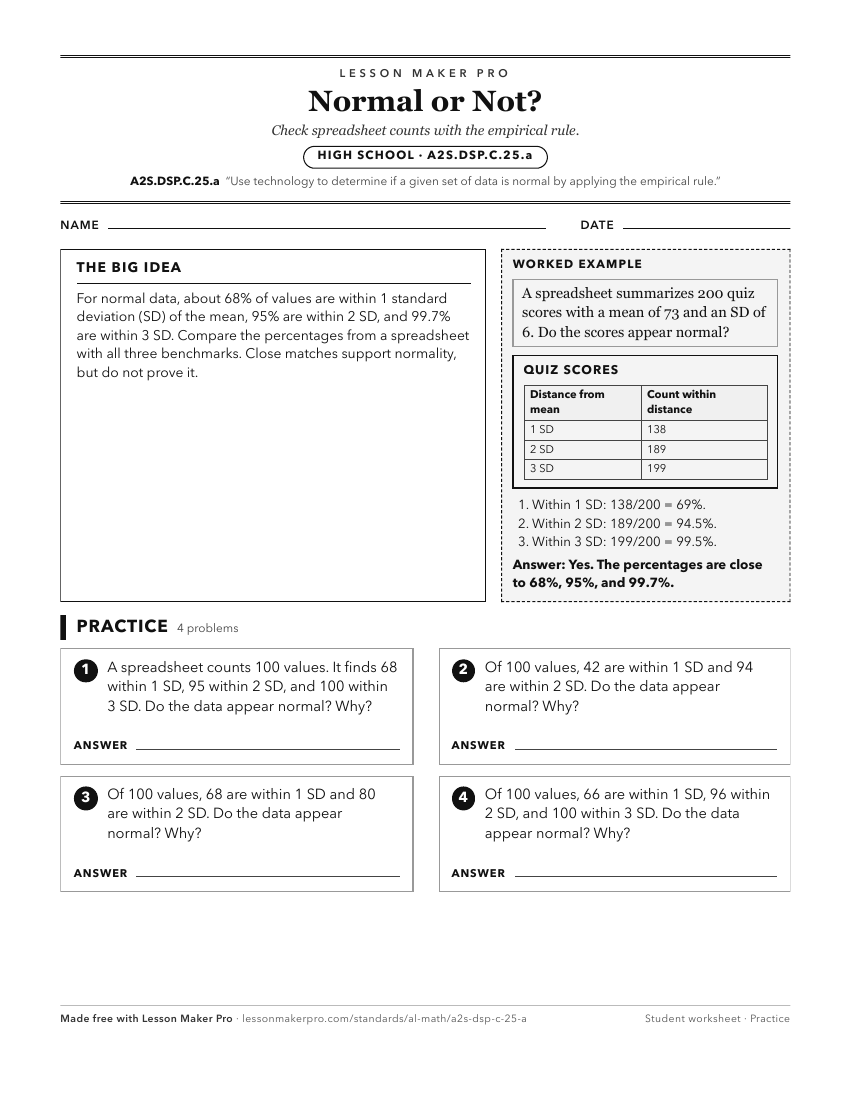
A ready-to-print activity worksheet aligned to A2S.DSP.C.25.a, with an answer key for the teacher on its own page. No account needed.
PDF, US Letter, prints cleanly in black and white.
Download the worksheetKeep exploring
Related Standards
- A2S.DSP.C.25
From a normal distribution, use technology to find the mean and standard deviation and estimate population percentages by applying the empirical rule.
- A2S.DSP.A.23
Use mathematical and statistical reasoning about normal distributions to draw conclusions and assess risk; limit to informal arguments.
- MM.D3D.C.18.a
Estimate the probability of each value for a random variable based on empirical observations or simulations, using technology.
- GDA.DSP.C.10.b
Calculate the standard deviation for a data set, using technology where appropriate.
Turn this exact standard into a lesson
Grade, subject, topic, and the complete standard are prefilled. Create one free, no account needed.
Also for this standard:Make a WorksheetMake a QuizMake a Sub Lesson