Alabama Math A2S.DSP.I.32.b
The Standard
- A2S.DSP.I
- The sampling distribution of a sample statistic formed from repeated samples for a given sample size drawn from a population can be used to identify typical behavior for that statistic. Examining several such sampling distributions leads to estimating a set of plausible values for the population parameter, using the margin of error as a measure that describes the sampling variability.
- A2S.DSP.I.32
- Produce a sampling distribution by repeatedly selecting samples of the same size from a given population or from a population simulated by bootstrapping (resampling with replacement from an observed sample). Do initial examples by hand, then use technology to generate a large number of samples.
Verify that 95% of sample means are within two standard deviations of the sampling distribution from the population mean.
2019 Alabama Course of Study: Mathematics · The sampling distribution of a sample statistic formed from repeated samples for a given sample size drawn from a population can be used to identify typical behavior for that statistic. Examining several such sampling distributions leads to estimating a set of plausible values for the population parameter, using the margin of error as a measure that describes the sampling variability.
Teacher's field guide
What This Standard Means
What Students Need to Do
- Students draw many random samples of the same size from a known population and find each sample mean. They check whether about 95% of those means fall within two standard deviations of the sampling distribution from the population mean.
What Mastery Looks Like
- Students calculate the two-standard-deviation interval around the population mean. They count the sample means inside it and report the percent. They know the result should be close to 95% when the distribution of sample means is roughly bell-shaped, not exactly 95% every time.
Common Misconceptions
- Students may use the standard deviation of individual values instead of the standard deviation of the sample means. They may also think exactly 95 out of 100 sample means must fall in the interval.
How to Assess It
- Exit ticket: A die has a population mean of 3.5. The standard deviation of 100 sample means is 0.35, and 96 means fall within two standard deviations of 3.5. Find the interval and explain whether the result supports the 95% claim.
Lesson moves
Ways to Teach It
Pairs roll ten dice five times, record each set's mean, and combine class results in a dot plot.
Ask: Why use the spread of sample means, rather than the spread of single die rolls, to check the 95% claim?
Use a spreadsheet to generate 100 samples of 25 die rolls, then count the means within two standard deviations of 3.5.
Use a spreadsheet to resample a posted list of 20 bus ride times 100 times and check the two-standard-deviation range for sample means.
Free download
Printable A2S.DSP.I.32.b Worksheet
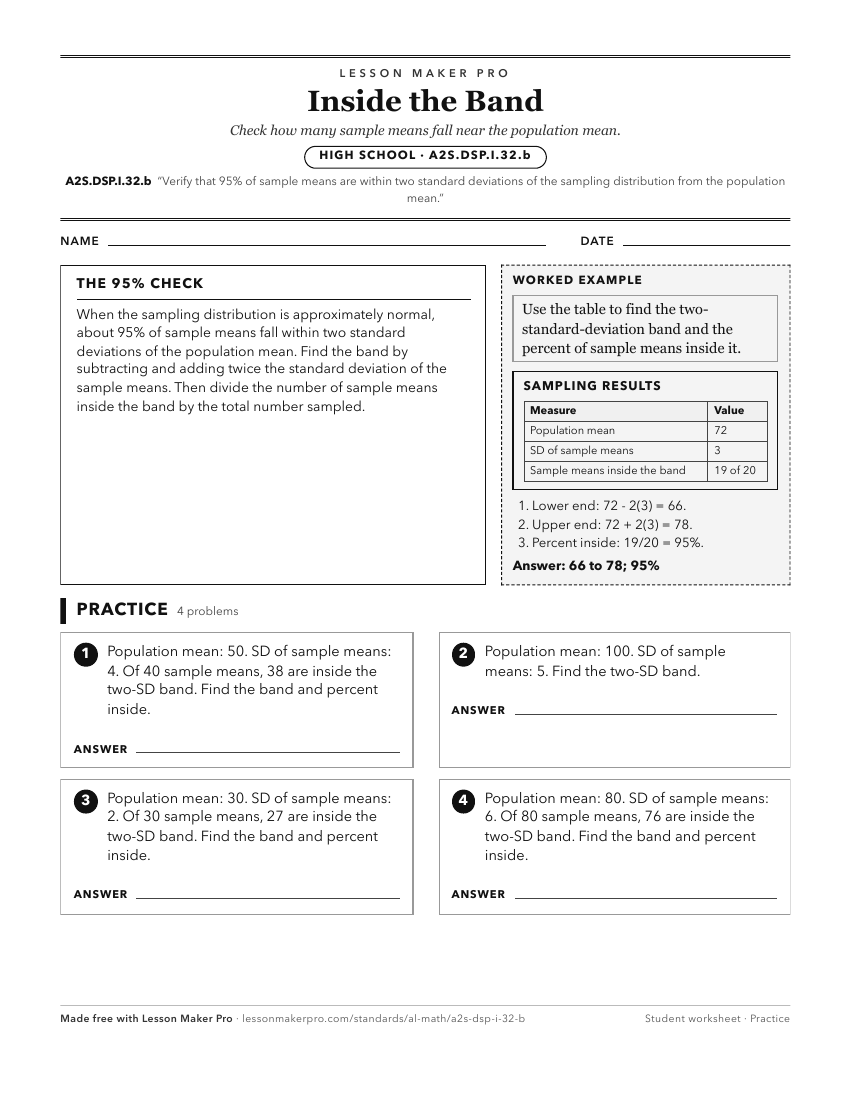
A ready-to-print activity worksheet aligned to A2S.DSP.I.32.b, with an answer key for the teacher on its own page. No account needed.
PDF, US Letter, prints cleanly in black and white.
Download the worksheetKeep exploring
Related Standards
- A2S.DSP.I.32.a
Verify that a sampling distribution is centered at the population mean and approximately normal if the sample size is large enough.
- A2S.DSP.I.32.c
Create and interpret a 95% confidence interval based on an observed mean from a sampling distribution.
- A2S.DSP.H.31.b
Demonstrate that the standard deviation of each simulated sampling distribution is the known standard deviation of the population divided by the square root of ...
- A2S.DSP.C.25
From a normal distribution, use technology to find the mean and standard deviation and estimate population percentages by applying the empirical rule.
Turn this exact standard into a lesson
Grade, subject, topic, and the complete standard are prefilled. Create one free, no account needed.
Also for this standard:Make a WorksheetMake a QuizMake a Sub Lesson