Alabama Math A2S.DSP.I.32.c
The Standard
- A2S.DSP.I
- The sampling distribution of a sample statistic formed from repeated samples for a given sample size drawn from a population can be used to identify typical behavior for that statistic. Examining several such sampling distributions leads to estimating a set of plausible values for the population parameter, using the margin of error as a measure that describes the sampling variability.
- A2S.DSP.I.32
- Produce a sampling distribution by repeatedly selecting samples of the same size from a given population or from a population simulated by bootstrapping (resampling with replacement from an observed sample). Do initial examples by hand, then use technology to generate a large number of samples.
Create and interpret a 95% confidence interval based on an observed mean from a sampling distribution.
2019 Alabama Course of Study: Mathematics · The sampling distribution of a sample statistic formed from repeated samples for a given sample size drawn from a population can be used to identify typical behavior for that statistic. Examining several such sampling distributions leads to estimating a set of plausible values for the population parameter, using the margin of error as a measure that describes the sampling variability.
Teacher's field guide
What This Standard Means
What Students Need to Do
- Students use an observed sample mean and the spread of sample means to build a 95% confidence interval. They find a margin of error, often about twice the standard error, and use it to estimate the population mean.
What Mastery Looks Like
- Given a sample mean of 8 and a standard error of 1, a student reports an interval from about 6 to 10. They explain that this method captures the population mean in about 95% of repeated samples.
Common Misconceptions
- Students may use the spread of individual values instead of the spread of sample means. They may say that 95% of the data fall inside the interval, or that their particular interval has a 95% chance of containing the fixed population mean.
How to Assess It
- Exit ticket: A sample mean is 42, and its roughly bell-shaped sampling distribution has a standard error of 3. Find an approximate 95% confidence interval for the population mean and explain what 95% means.
Lesson moves
Ways to Teach It
Draw 10 numbered slips with replacement five times, pool class sample means, and use twice their standard deviation to bracket one observed mean.
Ask, 'Does a 95% confidence interval contain 95% of the individual data values?' Have students explain their answer with a sketch.
Give pairs cards with sample means and standard errors; have them calculate intervals, then swap cards to check each other's endpoints.
Give students a cafeteria wait-time sample mean of 8 minutes and a standard error of 1 minute; ask for an interval and a manager-friendly interpretation.
Free download
Printable A2S.DSP.I.32.c Worksheet
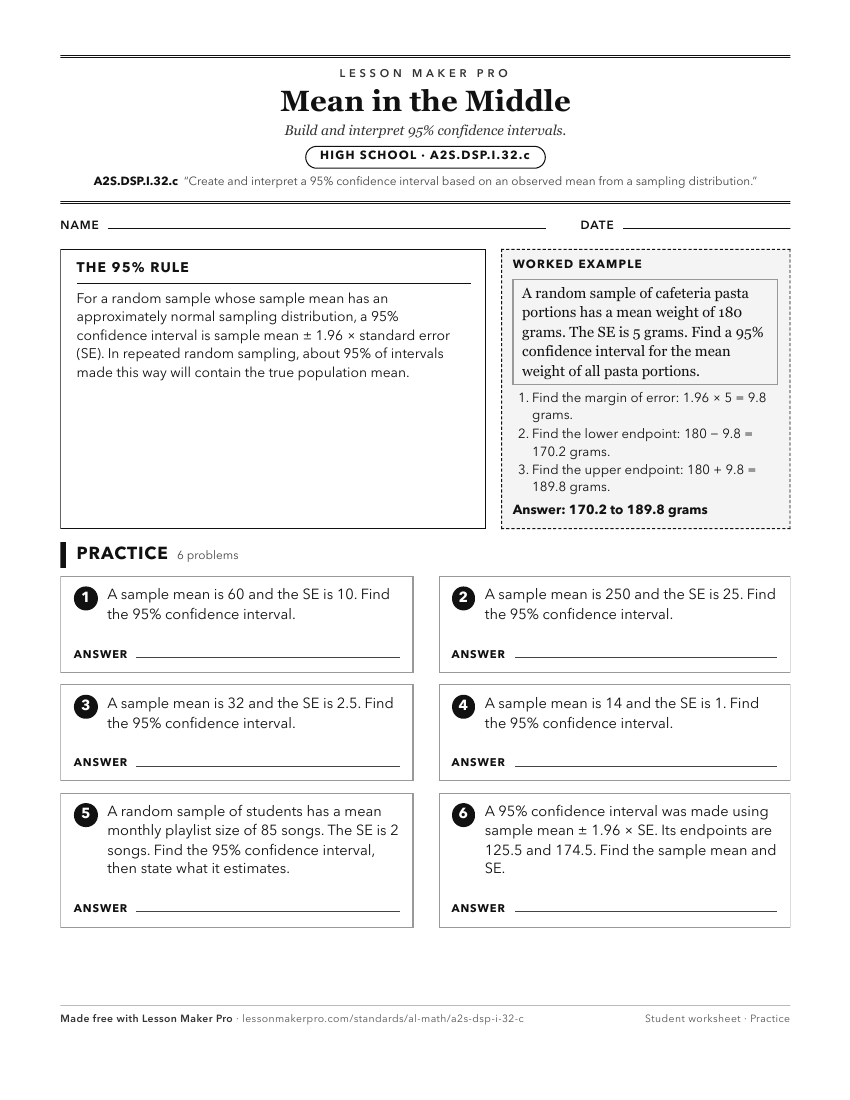
A ready-to-print activity worksheet aligned to A2S.DSP.I.32.c, with an answer key for the teacher on its own page. No account needed.
PDF, US Letter, prints cleanly in black and white.
Download the worksheetKeep exploring
Related Standards
- MM.D3D.C.20.a
Use a point estimator and margin of error to construct a confidence interval for a proportion or mean.
- A2S.DSP.I.32.b
Verify that 95% of sample means are within two standard deviations of the sampling distribution from the population mean.
- MM.D3D.C.20.b
Interpret a confidence interval in context and use it to make strategic decisions.
- MM.D3D.C.19.c
Use the central limit theorem to construct a normal sampling distribution for the sample mean when conditions are met.
Turn this exact standard into a lesson
Grade, subject, topic, and the complete standard are prefilled. Create one free, no account needed.
Also for this standard:Make a WorksheetMake a QuizMake a Sub Lesson