Alabama Math MM.D3D.C.20.a
The Standard
- MM.D3D.C
- Statistical studies allow a conclusion to be drawn about a population that is too large to survey completely or about cause and effect in an experiment.
- MM.D3D.C.20
- Perform inference procedures based on the results of samples and experiments.
Use a point estimator and margin of error to construct a confidence interval for a proportion or mean.
2019 Alabama Course of Study: Mathematics · Statistical studies allow a conclusion to be drawn about a population that is too large to survey completely or about cause and effect in an experiment.
Teacher's field guide
What This Standard Means
What Students Need to Do
- Students use a sample mean or sample proportion as an estimate for a population. They subtract and add the margin of error to find a confidence interval.
What Mastery Looks Like
- A student can turn a sample proportion of 48% with a 4 percentage point margin of error into an interval from 44% to 52%. They can explain that the interval estimates the proportion in the whole population, not the result for every person.
Common Misconceptions
- Students may add the margin of error but forget to subtract it. Some treat the interval as a range for individual values rather than a population mean or proportion. Others confuse percentage points with a percent of the sample proportion.
How to Assess It
- Exit ticket: A random sample has a mean reading time of 18 minutes per day and a margin of error of 3 minutes. Write the interval and name what it estimates.
Lesson moves
Ways to Teach It
Have students draw 20 beads from a bag, find the proportion that are blue, and build an interval using a provided margin of error.
Ask: A poll finds 48% support with a 4 percentage point margin of error. What range would you report, and for whom?
Give pairs cards with sample means, margins of error, and intervals. Have them match each estimate to its correct interval.
Use a cafeteria survey: give students a sample proportion choosing pizza and a margin of error, then have them estimate the schoolwide proportion.
Free download
Printable MM.D3D.C.20.a Worksheet
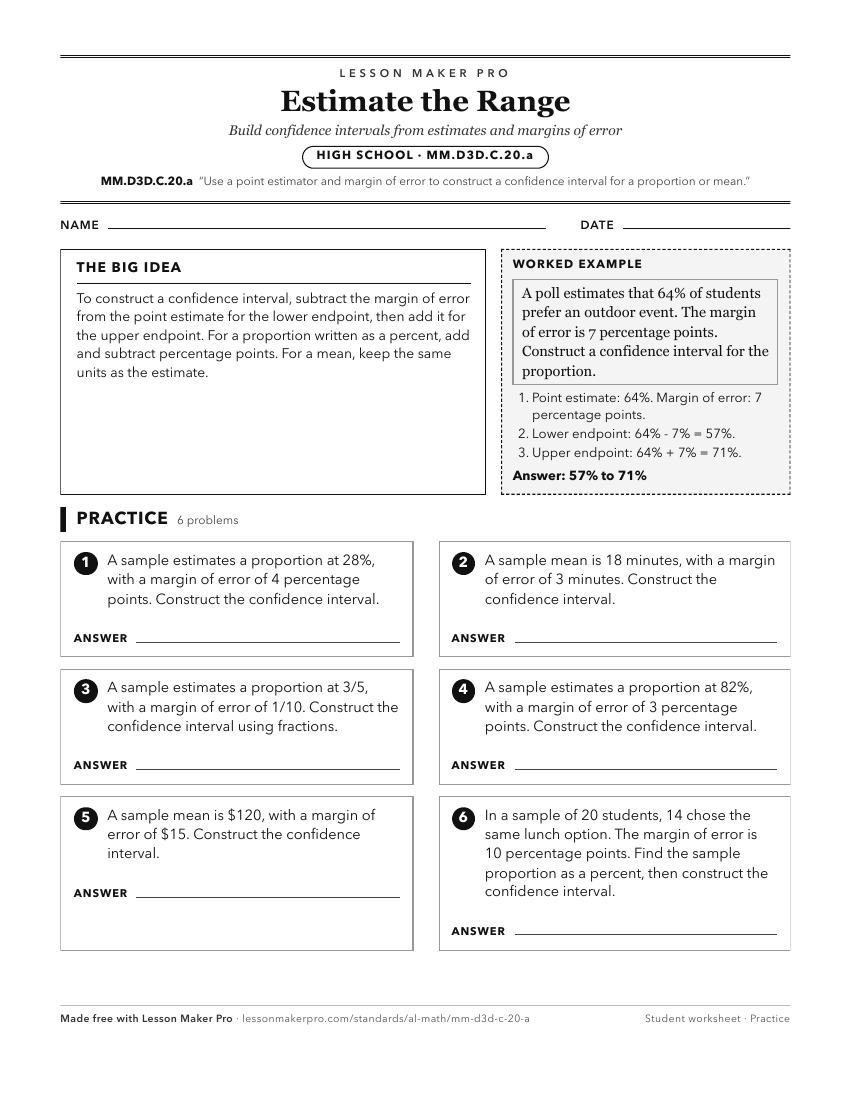
A ready-to-print activity worksheet aligned to MM.D3D.C.20.a, with an answer key for the teacher on its own page. No account needed.
PDF, US Letter, prints cleanly in black and white.
Download the worksheetKeep exploring
Related Standards
- A2S.DSP.I.32.c
Create and interpret a 95% confidence interval based on an observed mean from a sampling distribution.
- MM.D3D.C.19.b
Use the normal approximation of a proportion from a random event or sample when conditions are met.
- A2S.DSP.C.25
From a normal distribution, use technology to find the mean and standard deviation and estimate population percentages by applying the empirical rule.
- A2S.DSP.I.32.b
Verify that 95% of sample means are within two standard deviations of the sampling distribution from the population mean.
Turn this exact standard into a lesson
Grade, subject, topic, and the complete standard are prefilled. Create one free, no account needed.
Also for this standard:Make a WorksheetMake a QuizMake a Sub Lesson