Alabama Math MM.D3D.C.18.b
The Standard
- MM.D3D.C
- Statistical studies allow a conclusion to be drawn about a population that is too large to survey completely or about cause and effect in an experiment.
- MM.D3D.C.18
- Construct a probability distribution based on empirical observations of a variable.
Represent a probability distribution by a relative frequency histogram and/or a cumulative relative frequency graph.
2019 Alabama Course of Study: Mathematics · Statistical studies allow a conclusion to be drawn about a population that is too large to survey completely or about cause and effect in an experiment.
Teacher's field guide
What This Standard Means
What Students Need to Do
- Students use probabilities to draw bars showing the share for each outcome or interval. They add those shares in order to graph the proportion at or below each value.
What Mastery Looks Like
- A student labels the axes and draws bars at the correct heights. Their cumulative graph never falls, ends at 1, and lets them answer questions about values at or below a given point.
Common Misconceptions
- Students may put counts on the vertical axis instead of proportions. They may plot each outcome's probability on the cumulative graph without adding earlier probabilities.
How to Assess It
- Exit ticket: Outcomes 0, 1, 2, and 3 have probabilities 0.1, 0.2, 0.4, and 0.3. Draw both graphs and find the probability of 2 or less.
Lesson moves
Ways to Teach It
Roll two dice 36 times, tally the sums, and turn the relative frequencies into a histogram and cumulative graph.
Show a cumulative graph of commute times with a point at (15, 0.6); ask what it says about trips of 15 minutes or less.
Give pairs probability cards for three outcomes and matching histogram cards; have them find matches and sketch the cumulative totals.
Use bus waits of 2, 4, 5, 7, and 12 minutes to graph the share of waits at or below 5 and 10 minutes.
Free download
Printable MM.D3D.C.18.b Worksheet
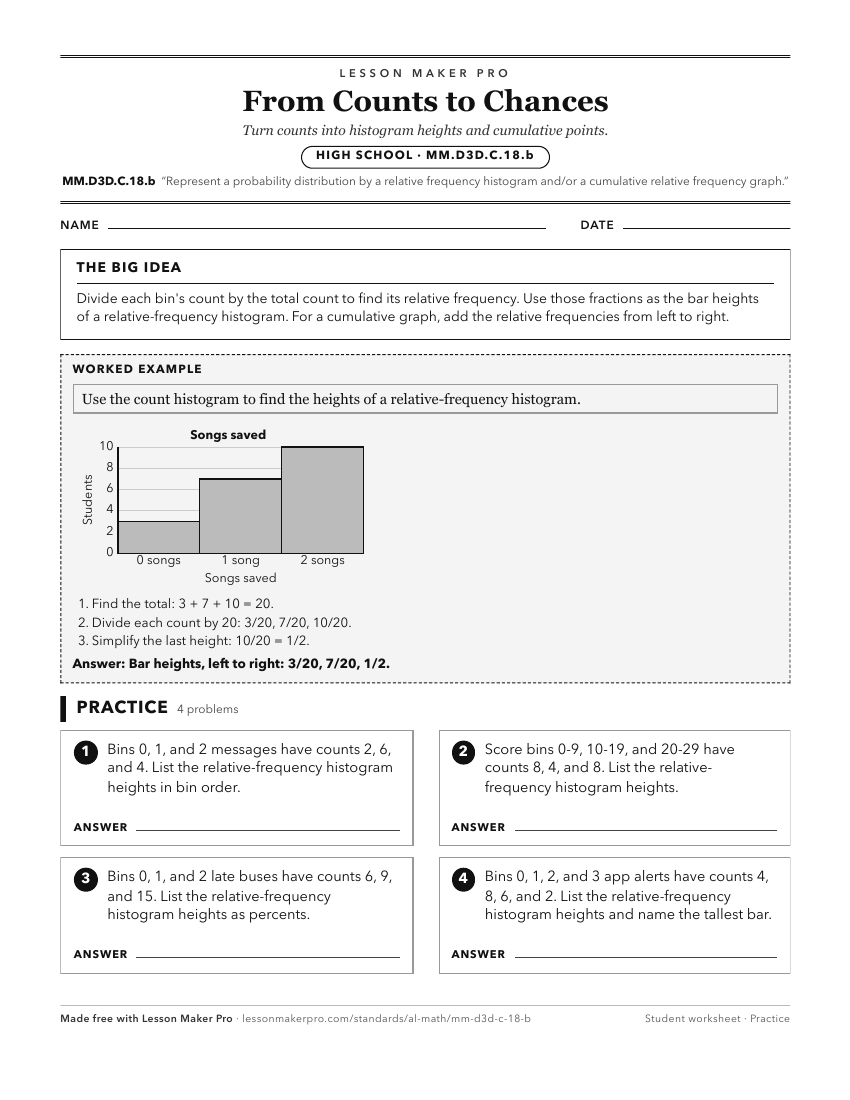
A ready-to-print activity worksheet aligned to MM.D3D.C.18.b, with an answer key for the teacher on its own page. No account needed.
PDF, US Letter, prints cleanly in black and white.
Download the worksheetKeep exploring
Related Standards
- A1P.DSP.D.35.b
Interpret relative frequencies in the context of categorical data (including joint, marginal, and conditional relative frequencies).
- 8A.DSP.C.39.b
Interpret relative frequencies in the context of categorical data (including joint, marginal, and conditional relative frequencies).
- 7A.DSP.C.31.a
Observe the relative frequency of an event over the long run, using simulation or technology, and use those results to predict approximate relative frequency.
- 7.DSP.C.15.a
Observe the relative frequency of an event over the long run, using simulation or technology, and use those results to predict approximate relative frequency.
Turn this exact standard into a lesson
Grade, subject, topic, and the complete standard are prefilled. Create one free, no account needed.
Also for this standard:Make a WorksheetMake a QuizMake a Sub Lesson