Alabama Math 7A.DSP.C.31.a
The Standard
- 7A.DSP.C
- Investigate probability models.
- 7A.DSP.C.31
- Approximate the probability of an event by using data generated by a simulation (experimental probability) and compare it to theoretical probability.
Observe the relative frequency of an event over the long run, using simulation or technology, and use those results to predict approximate relative frequency.
2019 Alabama Course of Study: Mathematics · Investigate probability models.
Teacher's field guide
What This Standard Means
What Students Need to Do
- Students run many trials of a chance event, using a simulation or repeated physical trials. They track the fraction of trials with a chosen outcome and use that fraction to predict its approximate share in future trials.
What Mastery Looks Like
- A student can use 62 blue results in 200 spins to find a relative frequency of 31%. They can predict about 31% blue results in another large set of spins without claiming the result will be exact.
Common Misconceptions
- Students may treat a short streak as proof that an outcome is likely to keep happening. They may also confuse the number of times an outcome occurs with its relative frequency, or expect the next set of trials to match the first exactly.
How to Assess It
- Exit ticket: A spinner lands on blue 62 times in 200 spins. What relative frequency would you predict for blue in the next 200 spins, and why might the result differ?
Lesson moves
Ways to Teach It
Have pairs flip a coin 50 times, record the heads fraction after every 10 flips, then combine class results.
Ask: Why might 10 coin flips give 70% heads while 200 flips give 51%? Use the class tally.
Use a random number generator for 200 die rolls; record the fraction of sixes every 50 rolls and predict the next 200.
Show 100 checkout records with 28 reusable bags; ask students to predict the reusable-bag share in the next 100 checkouts.
Free download
Printable 7A.DSP.C.31.a Worksheet
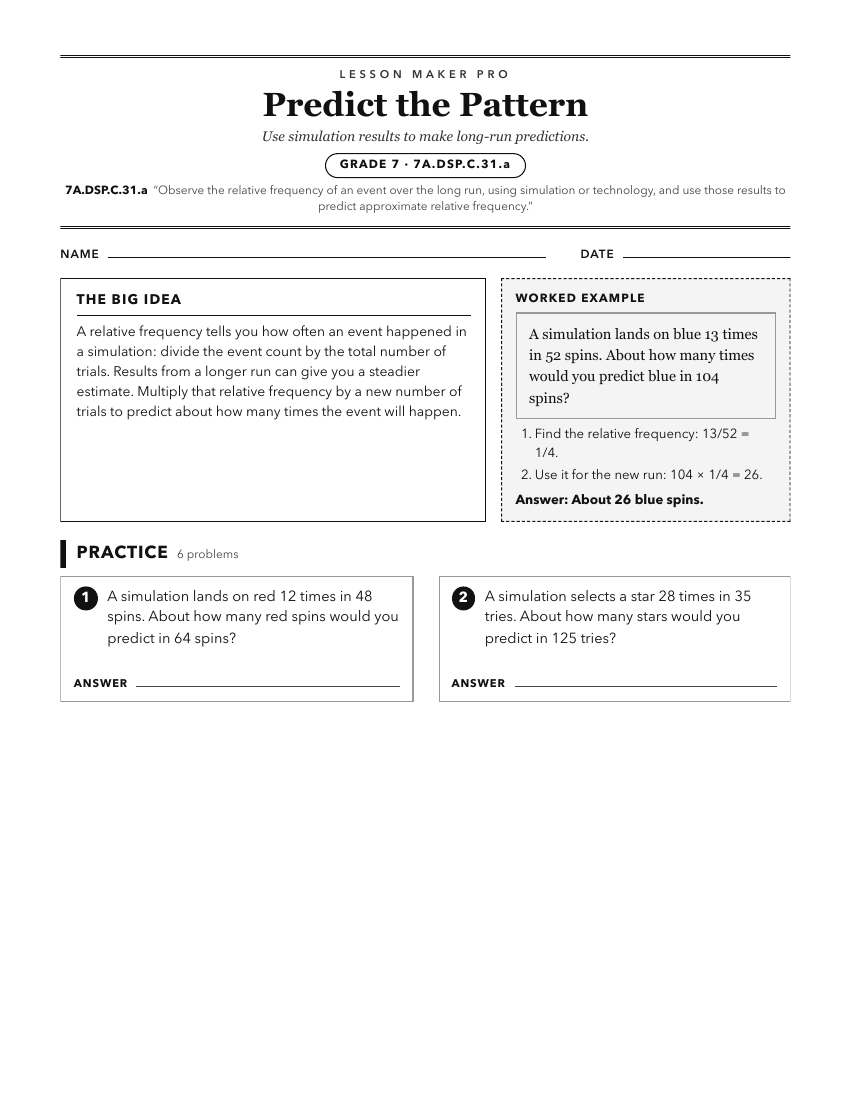
A ready-to-print activity worksheet aligned to 7A.DSP.C.31.a, with an answer key for the teacher on its own page. No account needed.
PDF, US Letter, prints cleanly in black and white.
Download the worksheetKeep exploring
Related Standards
- 7.DSP.C.15.a
Observe the relative frequency of an event over the long run, using simulation or technology, and use those results to predict approximate relative frequency.
- 7A.DSP.C.31
Approximate the probability of an event by using data generated by a simulation (experimental probability) and compare it to theoretical probability.
- 7.DSP.C.15
Approximate the probability of an event using data generated by a simulation (experimental probability) and compare it to the theoretical probability.
- MM.D3D.C.18.a
Estimate the probability of each value for a random variable based on empirical observations or simulations, using technology.
Turn this exact standard into a lesson
Grade, subject, topic, and the complete standard are prefilled. Create one free, no account needed.
Also for this standard:Make a WorksheetMake a QuizMake a Sub Lesson