Alabama Math MM.D3D.C.20
Standard Cluster
- MM.D3D.C
- Statistical studies allow a conclusion to be drawn about a population that is too large to survey completely or about cause and effect in an experiment.
Perform inference procedures based on the results of samples and experiments. a. Use a point estimator and margin of error to construct a confidence interval for a proportion or mean. b. Interpret a confidence interval in context and use it to make strategic decisions. c. Perform a significance test for null and alternative hypotheses. d. Interpret the significance level of a test in the context of error probabilities, and use the results to make strategic decisions.
2019 Alabama Course of Study: Mathematics
Cluster contents
Standards in This Cluster
MM.D3D.C.20 is a cluster heading. These are the individual standards under it.
- MM.D3D.C.20.a
Use a point estimator and margin of error to construct a confidence interval for a proportion or mean.
- MM.D3D.C.20.b
Interpret a confidence interval in context and use it to make strategic decisions.
- MM.D3D.C.20.c
Perform a significance test for null and alternative hypotheses.
- MM.D3D.C.20.d
Interpret the significance level of a test in the context of error probabilities, and use the results to make strategic decisions.
Teacher's field guide
What This Cluster Means
What Students Need to Do
- Students use a sample mean or proportion and a margin of error to find a confidence interval. They test a claim with null and alternative hypotheses. They interpret the results before making a decision.
What Mastery Looks Like
- They calculate an interval and describe plausible values for the population mean or proportion. They compare a p-value with a chosen significance level and make a decision tied to the claim. They explain that a 5% significance level means a 5% long-run chance of rejecting a true null hypothesis.
Common Misconceptions
- Students may say a calculated 95% interval gives the fixed population value a 95% chance of falling inside it. They may read a p-value as the chance the null hypothesis is true. They may treat a 5% significance level as the chance their particular decision is wrong.
How to Assess It
- Exit ticket: A random poll gives 57% lunch approval, a 95% margin of error of 5 percentage points, and p = 0.004 for testing approval against 50%. Find the interval, decide at a 5% significance level whether approval exceeds 50%, and explain what that level means.
Lesson moves
Ways to Teach It
Put 60 blue and 40 red chips in a bag; pairs sample 20, then build an interval using a supplied margin of error.
Write a two-sentence note to a principal explaining why p = 0.02 is not a 2% chance that the null claim is true.
Sort cards with p-values of 0.01, 0.06, and 0.20 at a 5% significance level; place each under reject or do not reject.
Show a city bus survey reporting 62% support with a 6-point margin of error; ask if adding a route has majority support.
Free download
Printable MM.D3D.C.20 Worksheet
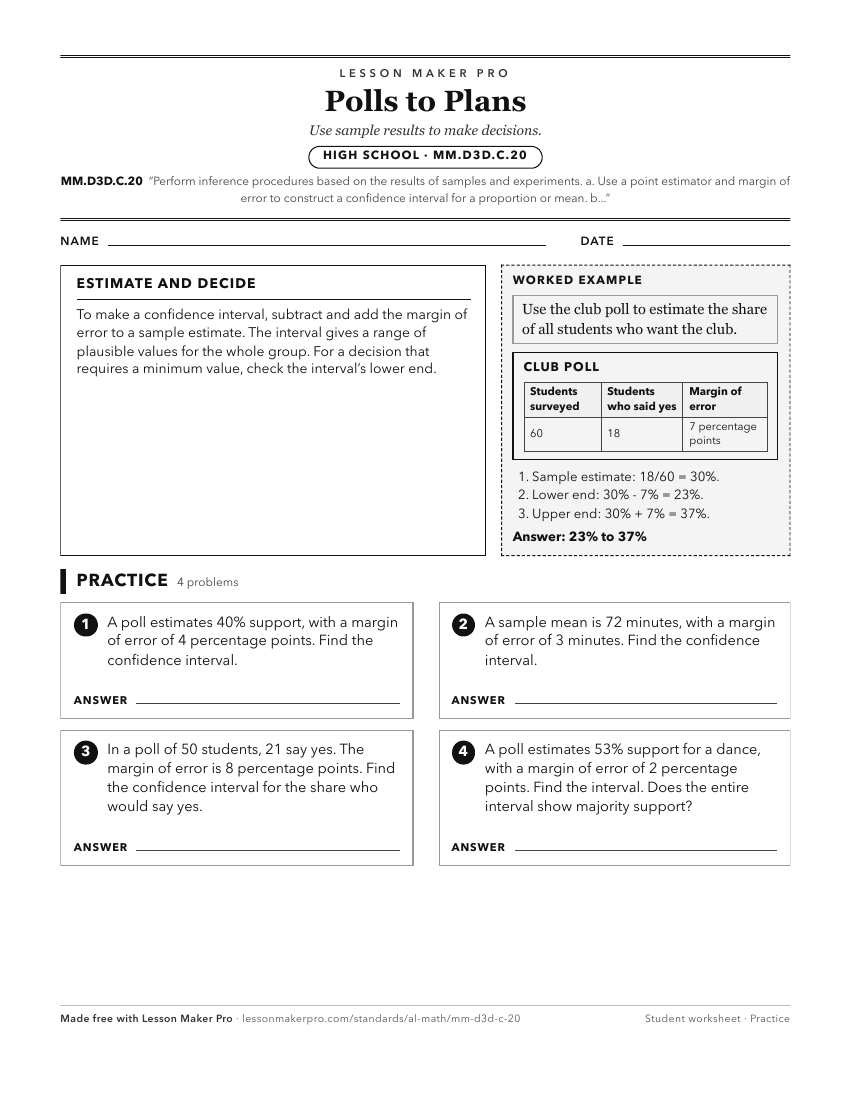
A ready-to-print activity worksheet aligned to MM.D3D.C.20, with an answer key for the teacher on its own page. No account needed.
PDF, US Letter, prints cleanly in black and white.
Download the worksheetKeep exploring
Related Standards
- 7.DSP.A.10.d
Use data from a random sample to draw inferences about a population with an unknown characteristic of interest, generating multiple samples to gauge variation a...
- 7A.DSP.A.26.d
Use data from a random sample to draw inferences about a population with an unknown characteristic of interest, generating multiple samples to gauge variation a...
Turn this cluster into a lesson
Grade, subject, topic, and the complete cluster are prefilled. Create one free, no account needed.
Also for this cluster:Make a WorksheetMake a QuizMake a Sub Lesson