Alabama Math MM.D3D.C.19
Standard Cluster
- MM.D3D.C
- Statistical studies allow a conclusion to be drawn about a population that is too large to survey completely or about cause and effect in an experiment.
Construct a sampling distribution for a random event or random sample. a. Use the binomial theorem to construct the sampling distribution for the number of successes in a binary event or the number of positive responses to a yes/no question in a random sample. b. Use the normal approximation of a proportion from a random event or sample when conditions are met. c. Use the central limit theorem to construct a normal sampling distribution for the sample mean when conditions are met. d. Find the long-term probability of a given range of outcomes from a random event or random sample.
2019 Alabama Course of Study: Mathematics
Cluster contents
Standards in This Cluster
MM.D3D.C.19 is a cluster heading. These are the individual standards under it.
- MM.D3D.C.19.a
Use the binomial theorem to construct the sampling distribution for the number of successes in a binary event or the number of positive responses to a yes/no qu...
- MM.D3D.C.19.b
Use the normal approximation of a proportion from a random event or sample when conditions are met.
- MM.D3D.C.19.c
Use the central limit theorem to construct a normal sampling distribution for the sample mean when conditions are met.
- MM.D3D.C.19.d
Find the long-term probability of a given range of outcomes from a random event or random sample.
Teacher's field guide
What This Cluster Means
What Students Need to Do
- Students use binomial coefficients to find probabilities for each possible yes count. When conditions allow, they use normal curves for sample proportions and sample means. They find the chance that a result falls in a stated range over many samples.
What Mastery Looks Like
- A student can build a count distribution for 20 independent yes/no trials using a given success rate. They check conditions before using a normal model. They use the right center and standard error to find a range probability.
Common Misconceptions
- Students confuse a yes count with a sample proportion. They use a normal curve even when expected yes or no counts are small. For sample means, they forget to divide the population standard deviation by the square root of the sample size.
How to Assess It
- In 100 independent yes/no trials with a 40% yes rate, estimate the probability of at least 46 yes answers using a normal approximation. Show your cutoff and check both expected counts.
Lesson moves
Ways to Teach It
Pairs draw five times with replacement from ten red and ten blue counters, then compare class red-count frequencies with binomial probabilities.
Ask, 'Why are means of 40 skewed commute times closer to normal than means of four, and how does their spread change?'
Give pairs cards labeled n and p for independent trials; have them sort by whether np and n(1-p) both reach 10.
For 60 independent cafeteria survey responses with a usual 30% yes rate, estimate how often at least 25 will be yes.
Free download
Printable MM.D3D.C.19 Worksheet
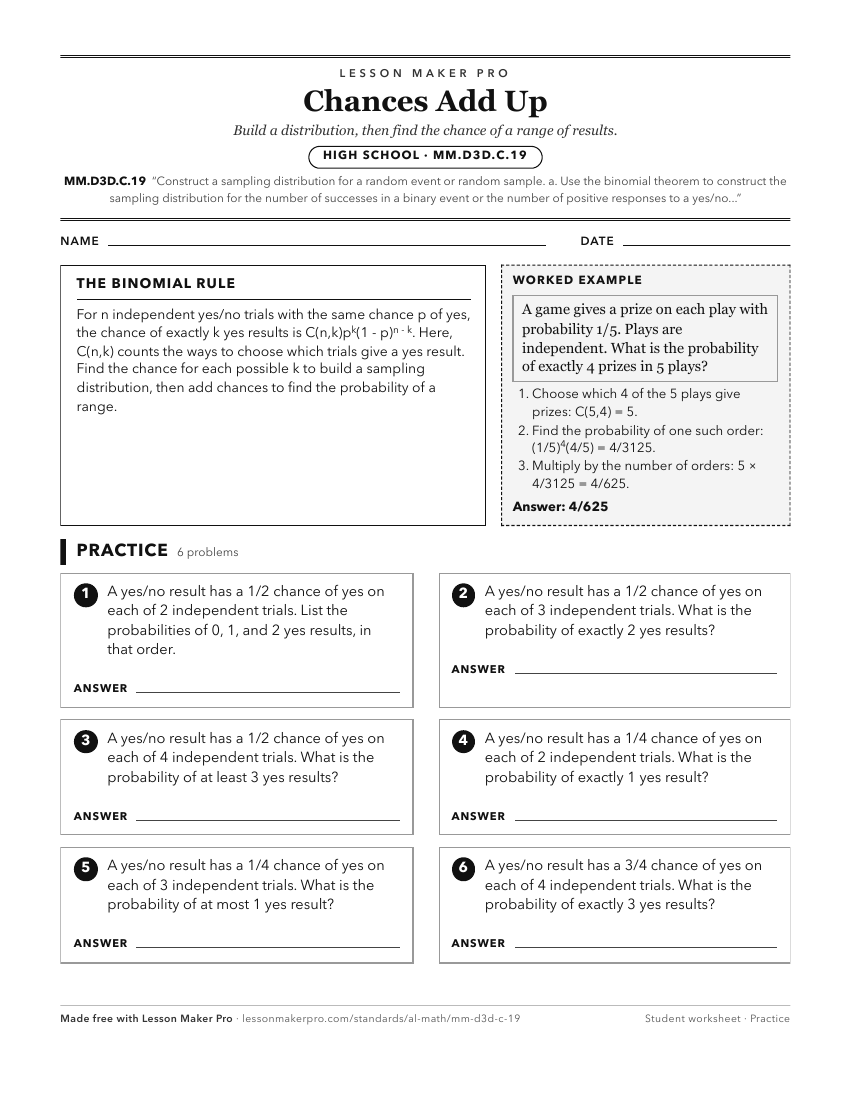
A ready-to-print activity worksheet aligned to MM.D3D.C.19, with an answer key for the teacher on its own page. No account needed.
PDF, US Letter, prints cleanly in black and white.
Download the worksheetKeep exploring
Related Standards
- A2S.DSP.I.32
Produce a sampling distribution by repeatedly selecting samples of the same size from a given population or from a population simulated by bootstrapping (resamp...
- MM.D3D.C.18
Construct a probability distribution based on empirical observations of a variable.
- 7A.DSP.A.26.d
Use data from a random sample to draw inferences about a population with an unknown characteristic of interest, generating multiple samples to gauge variation a...
- 7.DSP.A.10.d
Use data from a random sample to draw inferences about a population with an unknown characteristic of interest, generating multiple samples to gauge variation a...
Turn this cluster into a lesson
Grade, subject, topic, and the complete cluster are prefilled. Create one free, no account needed.
Also for this cluster:Make a WorksheetMake a QuizMake a Sub Lesson