Alabama Math MM.D3D.C.18
Standard Cluster
- MM.D3D.C
- Statistical studies allow a conclusion to be drawn about a population that is too large to survey completely or about cause and effect in an experiment.
Construct a probability distribution based on empirical observations of a variable. a. Estimate the probability of each value for a random variable based on empirical observations or simulations, using technology. b. Represent a probability distribution by a relative frequency histogram and/or a cumulative relative frequency graph. c. Find the mean, standard deviation, median, and interquartile range of a probability distribution and make long-term predictions about future possibilities. Determine which measures are most appropriate based upon the shape of the distribution.
2019 Alabama Course of Study: Mathematics
Cluster contents
Standards in This Cluster
MM.D3D.C.18 is a cluster heading. These are the individual standards under it.
- MM.D3D.C.18.a
Estimate the probability of each value for a random variable based on empirical observations or simulations, using technology.
- MM.D3D.C.18.b
Represent a probability distribution by a relative frequency histogram and/or a cumulative relative frequency graph.
- MM.D3D.C.18.c
Find the mean, standard deviation, median, and interquartile range of a probability distribution and make long-term predictions about future possibilities. Dete...
Teacher's field guide
What This Cluster Means
What Students Need to Do
- Students use a spreadsheet or calculator to turn observed or simulated counts into estimated probabilities. They make a relative frequency histogram or cumulative graph and find the mean, standard deviation, median, and IQR. They use the graph’s shape to choose useful measures and predict what may happen over many trials.
What Mastery Looks Like
- Given 100 recorded bus waits, a student can estimate the chance of each wait time and make both types of graph. They can calculate all four measures and explain why median and IQR better describe skewed waits. They can use their estimates to predict how many of the next 200 buses will be late.
Common Misconceptions
- Students may divide a count by the number of possible values instead of the total number of observations. They may read a cumulative graph’s height as the chance of one exact value. They may use the mean and standard deviation for skewed data without noticing how a few large values affect the mean.
How to Assess It
- Give bus wait counts for 20 trips: 0 minutes, 8; 5 minutes, 7; 10 minutes, 4; 20 minutes, 1. Ask students to find the chance of waiting at least 10 minutes, predict how many of the next 40 trips will have that wait, and choose the better pair of measures to describe these waits.
Lesson moves
Ways to Teach It
Roll two dice 60 times, record the sums, then use a spreadsheet to make a relative frequency histogram.
Show a right-skewed wait-time graph and ask students to write why median and IQR describe it better than mean and standard deviation.
Simulate 200 die rolls in a spreadsheet, make a cumulative relative frequency graph, and predict how many of the next 100 rolls will be sixes.
Give students a table of 50 bus arrival delays and have them estimate the chance of waiting at least five minutes.
Free download
Printable MM.D3D.C.18 Worksheet
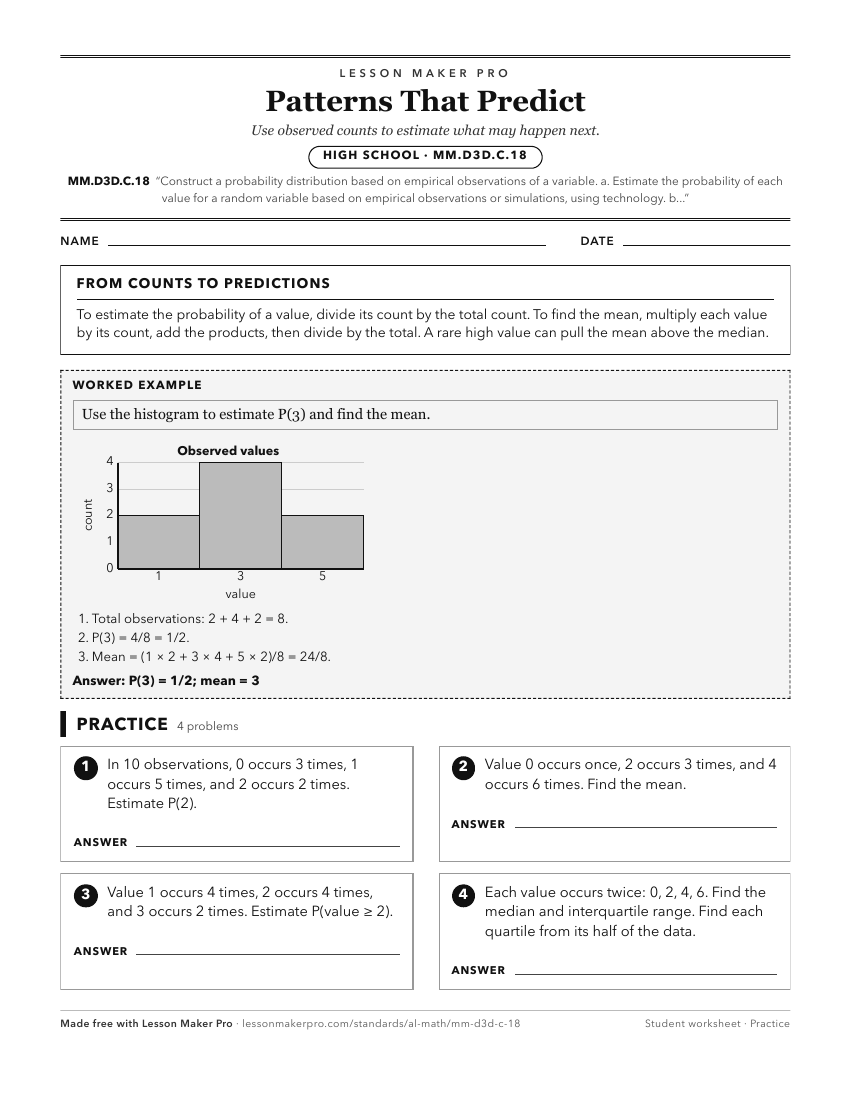
A ready-to-print activity worksheet aligned to MM.D3D.C.18, with an answer key for the teacher on its own page. No account needed.
PDF, US Letter, prints cleanly in black and white.
Download the worksheetKeep exploring
Related Standards
Turn this cluster into a lesson
Grade, subject, topic, and the complete cluster are prefilled. Create one free, no account needed.
Also for this cluster:Make a WorksheetMake a QuizMake a Sub Lesson