Alabama Math MM.D3D.C.19.d
The Standard
- MM.D3D.C
- Statistical studies allow a conclusion to be drawn about a population that is too large to survey completely or about cause and effect in an experiment.
- MM.D3D.C.19
- Construct a sampling distribution for a random event or random sample.
Find the long-term probability of a given range of outcomes from a random event or random sample.
2019 Alabama Course of Study: Mathematics · Statistical studies allow a conclusion to be drawn about a population that is too large to survey completely or about cause and effect in an experiment.
Teacher's field guide
What This Standard Means
What Students Need to Do
- Students identify which outcomes fall in a range, including both endpoints. They use equally likely outcomes or repeated trials to find the chance of landing in that range. For random samples, they count how often a sample result falls in the range.
What Mastery Looks Like
- A student finds that 15 of 36 ordered dice pairs sum to 7 through 9, giving a probability of 5/12. They can estimate a chance from repeated samples and explain why the results vary.
Common Misconceptions
- Students may divide by the 11 possible sums instead of the 36 equally likely dice pairs. They may leave out an endpoint or expect exactly five hits in every 12 rolls.
How to Assess It
- Ask: Two fair dice are rolled. What is the long-run chance their sum is 7 through 9, including both endpoints? Show how you counted.
Lesson moves
Ways to Teach It
Pairs roll two dice 30 times, tally sums from 7 through 9, then pool class results to estimate the long-run chance.
Ask: If 8 of 12 rolls land from 7 through 9, why might the next 12 rolls look different?
Give teams 36 ordered dice-pair cards to sort by whether the sums fall from 7 through 9, then calculate the probability.
Use a school bus arrival log to estimate the chance a randomly chosen bus is 0 to 5 minutes late.
Free download
Printable MM.D3D.C.19.d Worksheet
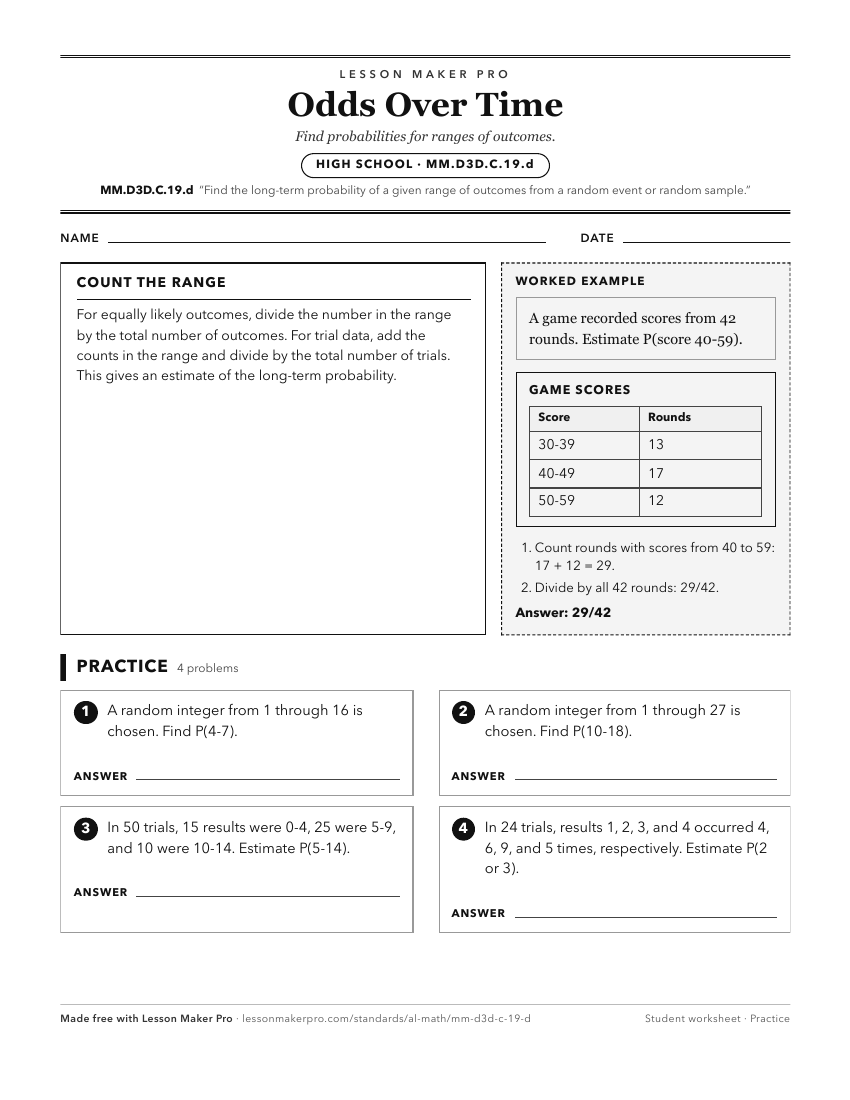
A ready-to-print activity worksheet aligned to MM.D3D.C.19.d, with an answer key for the teacher on its own page. No account needed.
PDF, US Letter, prints cleanly in black and white.
Download the worksheetKeep exploring
Related Standards
- MM.D3D.C.18.a
Estimate the probability of each value for a random variable based on empirical observations or simulations, using technology.
- 7.DSP.C.16
Find probabilities of simple and compound events through experimentation or simulation and by analyzing the sample space, representing the probabilities as perc...
- 7A.DSP.C.32
Find probabilities of simple and compound events through experimentation or simulation and by analyzing the sample space, representing the probabilities as perc...
- 7A.DSP.C.31.a
Observe the relative frequency of an event over the long run, using simulation or technology, and use those results to predict approximate relative frequency.
Turn this exact standard into a lesson
Grade, subject, topic, and the complete standard are prefilled. Create one free, no account needed.
Also for this standard:Make a WorksheetMake a QuizMake a Sub Lesson