Mississippi Science PHY.1
Standard Cluster
Students will investigate and understand how to analyze and interpret data. Investigate and analyze evidence gained through observation or experimental design regarding the one-dimensional (1-D) motion of objects. Design and conduct experiments to generate and interpret graphical evidence of distance, velocity, and acceleration through motion. Interpret and predict 1-D motion based on displacement vs. time, velocity vs. time, or acceleration vs. time graphs (e.g., free-falling objects). Use mathematical and computational analysis to solve problems using kinematic equations. Use graphical analysis to derive kinematic equations. Differentiate and give examples of motion concepts such as distance-displacement, speed-velocity, and acceleration. Design and mathematically/graphically analyze quantitative data to explore displacement, velocity, and acceleration of various objects. Use probe systems, video analysis, graphical analysis software, digital spreadsheets, and/or online simulations. Design different scenarios, and predict graph shapes for distance/time, velocity/time, and acceleration/time graphs. Given a 1D motion graph students should replicate the motion predicted by the graph.
2026 Mississippi College- and Career-Readiness Standards for Science · One-Dimensional Motion
Cluster contents
Standards in This Cluster
PHY.1 is a cluster heading. These are the individual standards under it.
- PHY.1.1
Investigate and analyze evidence gained through observation or experimental design regarding the one-dimensional (1-D) motion of objects. Design and conduct exp...
- PHY.1.2
Interpret and predict 1-D motion based on displacement vs. time, velocity vs. time, or acceleration vs. time graphs (e.g., free-falling objects).
- PHY.1.3
Use mathematical and computational analysis to solve problems using kinematic equations.
- PHY.1.4
Use graphical analysis to derive kinematic equations.
- PHY.1.5
Differentiate and give examples of motion concepts such as distance-displacement, speed-velocity, and acceleration.
- PHY.1.6
Design and mathematically/graphically analyze quantitative data to explore displacement, velocity, and acceleration of various objects. Use probe systems, video...
- PHY.1.7
Design different scenarios, and predict graph shapes for distance/time, velocity/time, and acceleration/time graphs.
- PHY.1.8
Given a 1D motion graph students should replicate the motion predicted by the graph.
Teacher's field guide
What This Cluster Means
What Students Need to Do
- Students measure motion along a straight line and turn their data into position-time, velocity-time, and acceleration-time graphs. They use slopes, areas, and motion equations to describe and predict movement. They also move in ways that match a given graph.
What Mastery Looks Like
- A student can describe when a walker moves forward, pauses, or turns around from a position-time graph. They find velocity from its slope, acceleration from a velocity-time slope, and displacement from the signed area under that graph. They use a motion equation to check a prediction against the graph.
Common Misconceptions
- Students may read a high point on a position-time graph as high speed, instead of checking its slope. They may count a return trip as zero distance because its displacement is zero. They may assume negative acceleration always means slowing down.
How to Assess It
- Exit ticket: Sketch a velocity-time graph rising from 0 to 6 m/s in 3 s, then staying at 6 m/s until 5 s. Ask students to find the first interval's acceleration and total displacement, with calculations.
Lesson moves
Ways to Teach It
Mark a hallway every meter, film a classmate walking away, stopping, and returning, then plot position against time from video frames.
Show an out-and-back position-time graph and ask, "How can final displacement be zero when distance traveled is not?"
Give pairs three velocity-time graph cards and three motion descriptions; have them match each card and justify one match.
Draw a straight velocity-time line for a train braking from 20 m/s to zero in 10 s; find acceleration and stopping distance.
Free download
Printable PHY.1 Worksheet
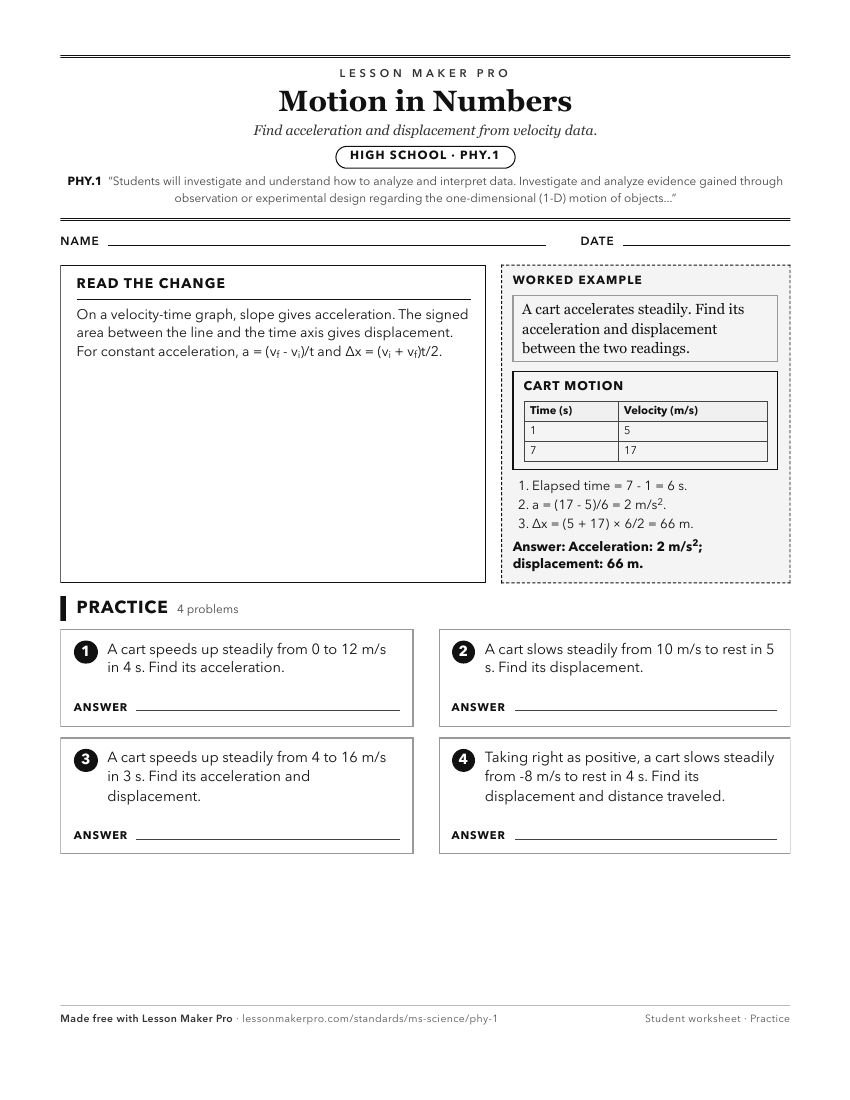
A ready-to-print activity worksheet aligned to PHY.1, with an answer key for the teacher on its own page. No account needed.
PDF, US Letter, prints cleanly in black and white.
Download the worksheetKeep exploring
Related Standards
- BIO.3B
Students will analyze and interpret data collected from probability calculations to explain the variation of expressed traits within a population.
- CHE.1
Students will use mathematical and computational analysis to evaluate problems.
- FSL.3B
Students will apply scientific literacy and thinking skills to analyze and interpret data found in various graphics including, but not limited to, those found i...
- GEN.4
Students will analyze and interpret data collected from probability calculations to explain the inheritance of traits within a population.
Turn this cluster into a lesson
Grade, subject, topic, and the complete cluster are prefilled. Create one free, no account needed.
Also for this cluster:Make a WorksheetMake a QuizMake a Sub Lesson