Mississippi Science FSL.3B
Standard Cluster
Students will apply scientific literacy and thinking skills to analyze and interpret data found in various graphics including, but not limited to, those found in sample ACT science passages. Analyze select data from a simple and complex data presentation (e.g., charts, graphs, diagrams). Compare or combine data from two or more simple data presentations (e.g., order or sum data from a table, categorize data from a table using a scale from another table, relationships between data sets). Translate information into a table, graph, or diagram. Determine patterns, trends, and relationships as the values of variables change. Perform a simple interpolation or simple extrapolation using data in a table or graph. Determine and/or use a simple (e.g., linear) mathematical relationship that exists between data. Analyze presented information when given new information (e.g., given a new scenario, how would a given scenario be changed).
2026 Mississippi College- and Career-Readiness Standards for Science · Nature of Science
Cluster contents
Standards in This Cluster
FSL.3B is a cluster heading. These are the individual standards under it.
- FSL.3B.1
Analyze select data from a simple and complex data presentation (e.g., charts, graphs, diagrams).
- FSL.3B.2
Compare or combine data from two or more simple data presentations (e.g., order or sum data from a table, categorize data from a table using a scale from anothe...
- FSL.3B.3
Translate information into a table, graph, or diagram. Determine patterns, trends, and relationships as the values of variables change.
- FSL.3B.4
Perform a simple interpolation or simple extrapolation using data in a table or graph. Determine and/or use a simple (e.g., linear) mathematical relationship th...
- FSL.3B.5
Analyze presented information when given new information (e.g., given a new scenario, how would a given scenario be changed).
Teacher's field guide
What This Cluster Means
What Students Need to Do
- Students read values and units from tables, graphs, and diagrams, even when a display has several parts. They combine data from two displays and turn data into a new table or graph. They describe trends, find simple rules, estimate values between or beyond given points, and revise conclusions when new information appears.
What Mastery Looks Like
- Given two distance-time tables, a student graphs both sets of data with labeled axes and compares the speeds. They state a distance-per-second rule and use it to estimate distances between measured times and just beyond them. They check whether a new data point fits the rule.
Common Misconceptions
- Students may read a graph without checking the axis scale or units. They may combine values with different units or assume every pattern is a straight line. They may present a prediction beyond the data as if it were measured.
How to Assess It
- Exit ticket: Car A travels 0, 2, 4, 6 meters at 0, 1, 2, 3 seconds; car B travels 0, 3, 6, 9 meters at the same times. Ask students to graph both, compare their speeds, and estimate car A's distance at 1.5 and 4 seconds.
Lesson moves
Ways to Teach It
Walk at a steady pace for five seconds while a partner marks each second's position with tape, then graph distance over time.
Show a temperature graph and dissolved oxygen table from the same samples; ask which values support a claim about their relationship.
Give pairs a distance-time table with one missing entry; have them fill it using the pattern, then estimate the next entry.
Use a bus timetable and route map to estimate arrival at an unlisted stop, then adjust for a five-minute delay.
Free download
Printable FSL.3B Worksheet
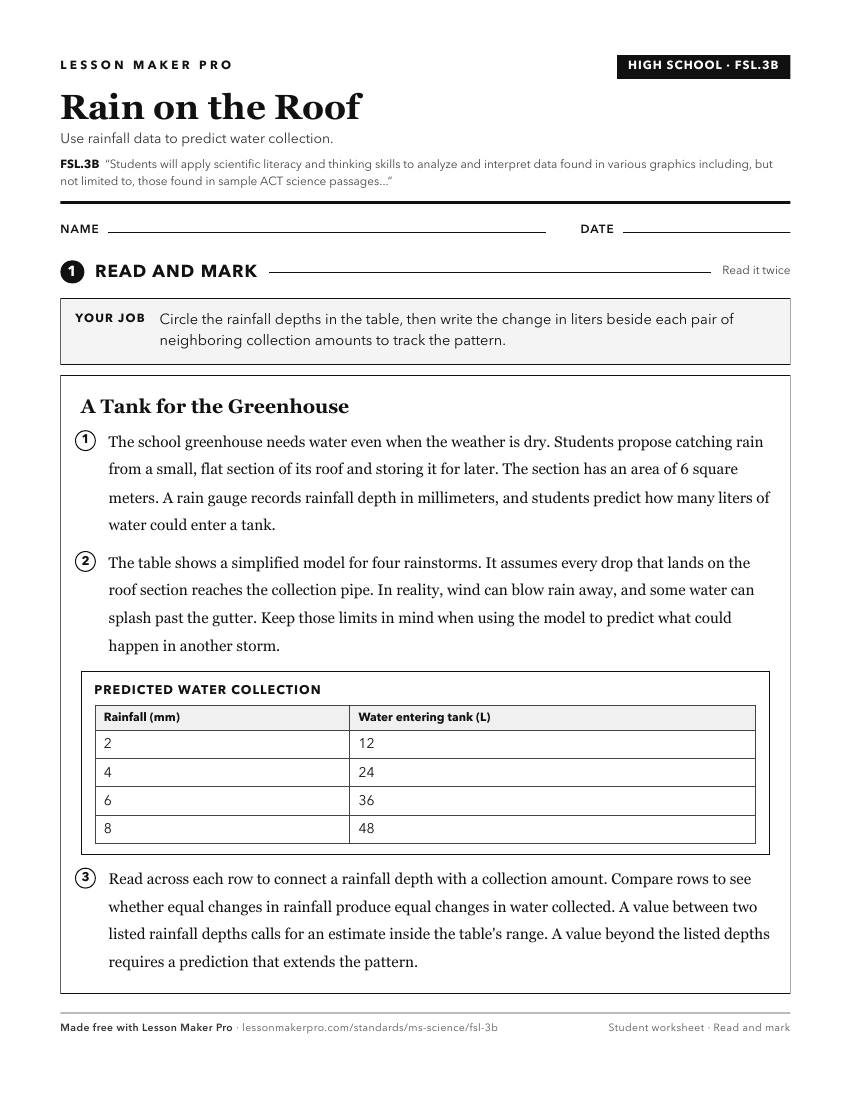
A ready-to-print activity worksheet aligned to FSL.3B, with an answer key for the teacher on its own page. No account needed.
PDF, US Letter, prints cleanly in black and white.
Download the worksheetKeep exploring
Related Standards
- FSL.3D
Students will apply scientific literacy and thinking skills to evaluate theoretical models, inferences, and experimental results found in various experimental d...
- FSL.3C
Students will apply scientific literacy and thinking skills to analyze scientific investigations found in various experimental designs including, but not limite...
- PHY.1
Students will investigate and understand how to analyze and interpret data.
- FSL.3A
Students will apply science and engineering practices and skills to scientific investigations.
Turn this cluster into a lesson
Grade, subject, topic, and the complete cluster are prefilled. Create one free, no account needed.
Also for this cluster:Make a WorksheetMake a QuizMake a Sub Lesson