Mississippi Science FSL.3B.4
The Standard
- FSL.3B
- Students will apply scientific literacy and thinking skills to analyze and interpret data found in various graphics including, but not limited to, those found in sample ACT science passages.
Perform a simple interpolation or simple extrapolation using data in a table or graph. Determine and/or use a simple (e.g., linear) mathematical relationship that exists between data.
2026 Mississippi College- and Career-Readiness Standards for Science · Nature of Science
Teacher's field guide
What This Standard Means
What Students Need to Do
- Students use a table or graph to estimate values between measured points and just beyond them. They find a steady rate of change and use it to make predictions.
What Mastery Looks Like
- From distance readings at 0, 2, and 4 seconds, a student finds a rate of 3 meters per second. They estimate 9 meters at 3 seconds and 15 meters at 5 seconds, noting that 5 seconds lies outside the data.
Common Misconceptions
- Students may call a value between measured points extrapolation, or assume every graph starts at zero. They may extend a pattern far beyond the data without asking whether the rate could change.
How to Assess It
- Exit ticket: A cart travels 0, 6, and 12 meters at 0, 2, and 4 seconds. Ask for its predicted distance at 3 and 5 seconds, its rate, and which prediction is extrapolation.
Lesson moves
Ways to Teach It
Mark a toy car’s position every second with tape, graph distance against time, and estimate its position halfway between two marks.
Show plant heights at weeks 0, 2, and 4, then ask why a week 3 estimate is safer than a week 10 prediction.
Give pairs times of 0, 2, 4, and 6 seconds with distances of 0, 6, 12, and 18 meters; predict distances at 3 and 8 seconds.
Use a thermometer conversion table with 0°C at 32°F and 100°C at 212°F; estimate 50°C and predict 110°C.
Free download
Printable FSL.3B.4 Worksheet
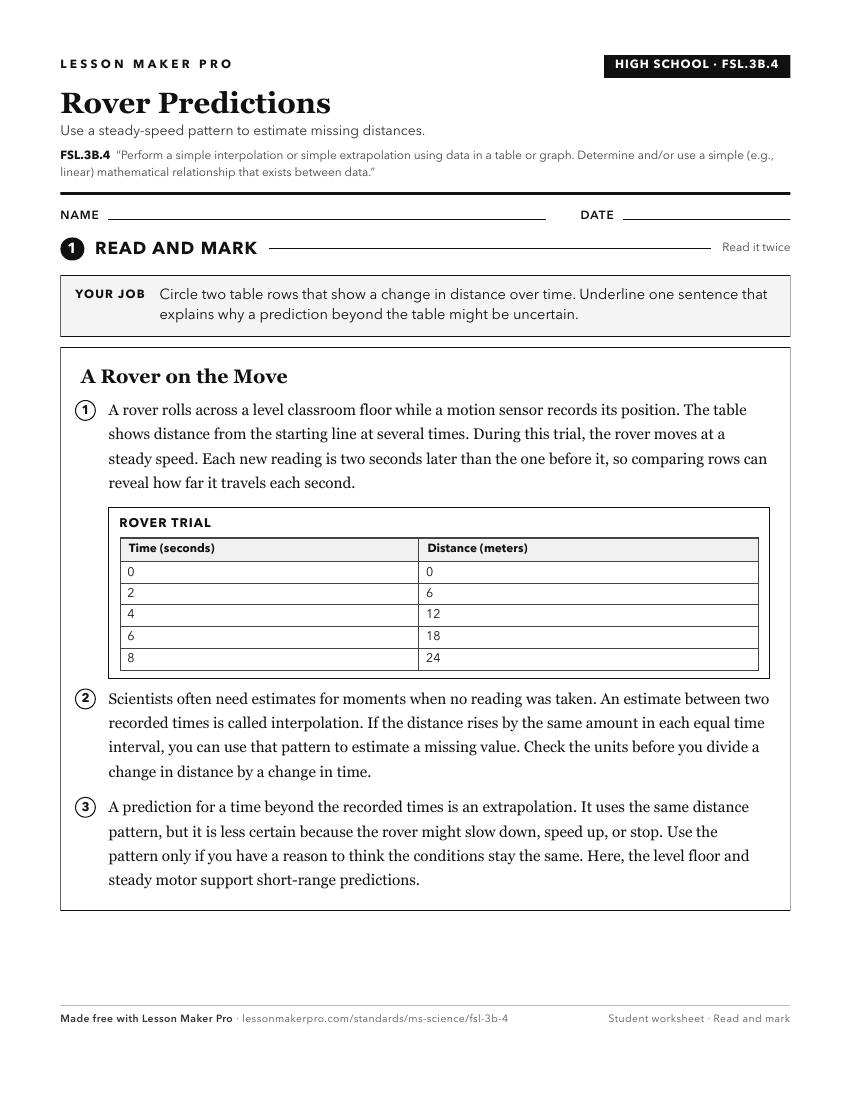
A ready-to-print activity worksheet aligned to FSL.3B.4, with an answer key for the teacher on its own page. No account needed.
PDF, US Letter, prints cleanly in black and white.
Download the worksheetKeep exploring
Related Standards
- FSL.3B.1
Analyze select data from a simple and complex data presentation (e.g., charts, graphs, diagrams).
- FSL.3A.4
Use mathematical and computational thinking to (1) use and manipulate appropriate metric units, (2) express relationships between variables for investigations, ...
- FSL.3B.3
Translate information into a table, graph, or diagram. Determine patterns, trends, and relationships as the values of variables change.
- FSL.3B.2
Compare or combine data from two or more simple data presentations (e.g., order or sum data from a table, categorize data from a table using a scale from anothe...
Turn this exact standard into a lesson
Grade, subject, topic, and the complete standard are prefilled. Create one free, no account needed.
Also for this standard:Make a WorksheetMake a QuizMake a Sub Lesson