Mississippi Science FSL.3B.3
The Standard
- FSL.3B
- Students will apply scientific literacy and thinking skills to analyze and interpret data found in various graphics including, but not limited to, those found in sample ACT science passages.
Translate information into a table, graph, or diagram. Determine patterns, trends, and relationships as the values of variables change.
2026 Mississippi College- and Career-Readiness Standards for Science · Nature of Science
Teacher's field guide
What This Standard Means
What Students Need to Do
- Put measurements into a table, graph, or diagram. Label the variables and units, then describe how the values change together.
What Mastery Looks Like
- A student graphs cooling-water data with time on the horizontal axis and temperature on the vertical axis. They use values from the graph to show that the water cools as time passes.
Common Misconceptions
- Students may swap the axes, leave off units, or use a scale that hides the pattern. They may also treat a trend as proof that one variable caused the other to change.
How to Assess It
- Give students these readings: at 0, 2, 4, and 6 minutes, water is 40, 35, 31, and 28°C. Ask for a labeled table, a line graph, and one sentence describing the trend.
Lesson moves
Ways to Teach It
Roll a toy car down a ramp from three marked heights, measure how far it travels, and graph height against distance.
Show two graphs of the same cooling data with different vertical scales, then ask, 'How does the scale change what the drop looks like?'
Race pairs to sort plant-height data cards by week, make a labeled graph, and support a trend statement with two values.
Use printed hourly temperatures from a local weather report to graph time against temperature and mark when warming turns to cooling.
Free download
Printable FSL.3B.3 Worksheet
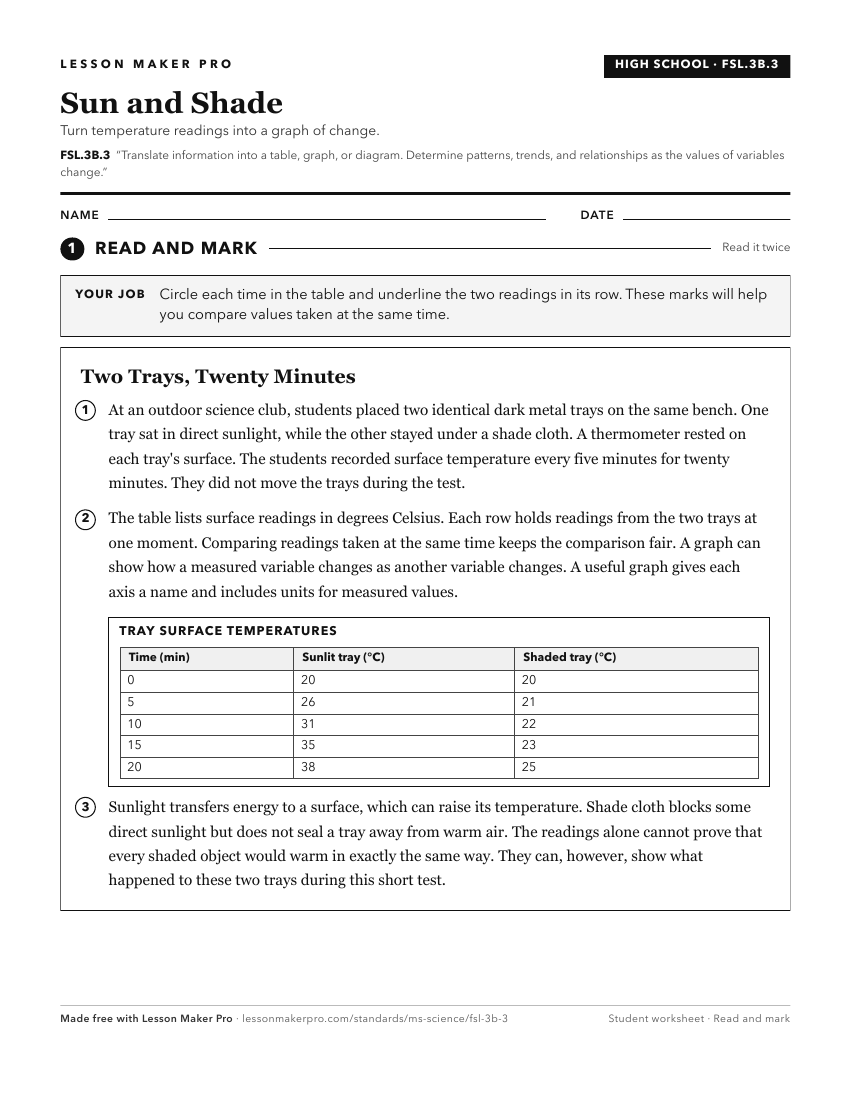
A ready-to-print activity worksheet aligned to FSL.3B.3, with an answer key for the teacher on its own page. No account needed.
PDF, US Letter, prints cleanly in black and white.
Download the worksheetKeep exploring
Related Standards
- FSL.3B.1
Analyze select data from a simple and complex data presentation (e.g., charts, graphs, diagrams).
- FSL.3A.2
Analyze data from simple experiments and construct organized models (e.g., data tables, graphs) detailing results from the experiments.
- FSL.3D.3
Analyze and interpret data from informational texts and data to (1) reveal patterns and construct meaning (2) support or refute hypotheses, explanations, claims...
- FSL.3B.4
Perform a simple interpolation or simple extrapolation using data in a table or graph. Determine and/or use a simple (e.g., linear) mathematical relationship th...
Turn this exact standard into a lesson
Grade, subject, topic, and the complete standard are prefilled. Create one free, no account needed.
Also for this standard:Make a WorksheetMake a QuizMake a Sub Lesson