Mississippi Science FSL.3B.2
The Standard
- FSL.3B
- Students will apply scientific literacy and thinking skills to analyze and interpret data found in various graphics including, but not limited to, those found in sample ACT science passages.
Compare or combine data from two or more simple data presentations (e.g., order or sum data from a table, categorize data from a table using a scale from another table, relationships between data sets).
2026 Mississippi College- and Career-Readiness Standards for Science · Nature of Science
Teacher's field guide
What This Standard Means
What Students Need to Do
- Students find matching labels in two tables or in a table and a graph. They add, order, or compare the values, then explain what the combined data shows.
What Mastery Looks Like
- A student matches entries even when the sources list them in different orders. They calculate accurately and support a comparison with values from both sources.
Common Misconceptions
- Students may pair values by row position when the tables list sites in different orders. They may add values with different units or claim a pattern after checking only one pair.
How to Assess It
- Give students two tables: rainfall (mm), A 2, B 6, C 4; runoff (mL), C 14, A 8, B 20. Ask, 'Order the sites by rainfall from least to greatest. Does runoff follow the same order? Use two matched pairs as evidence.'
Lesson moves
Ways to Teach It
Give pairs two tables of daily rainfall for three towns; have them cut paper strips to scale, join matching towns, and rank two-day totals.
Show two tables of lunches sold on Monday and Tuesday; ask, 'Which lunch sold most across both days? Which numbers prove it?'
Give pairs lap-one and lap-two time tables for four runners; have them match names, add times, and rank the finishers.
Post two tables of daily school electricity use and outdoor temperature; have students identify days when both values rose.
Free download
Printable FSL.3B.2 Worksheet
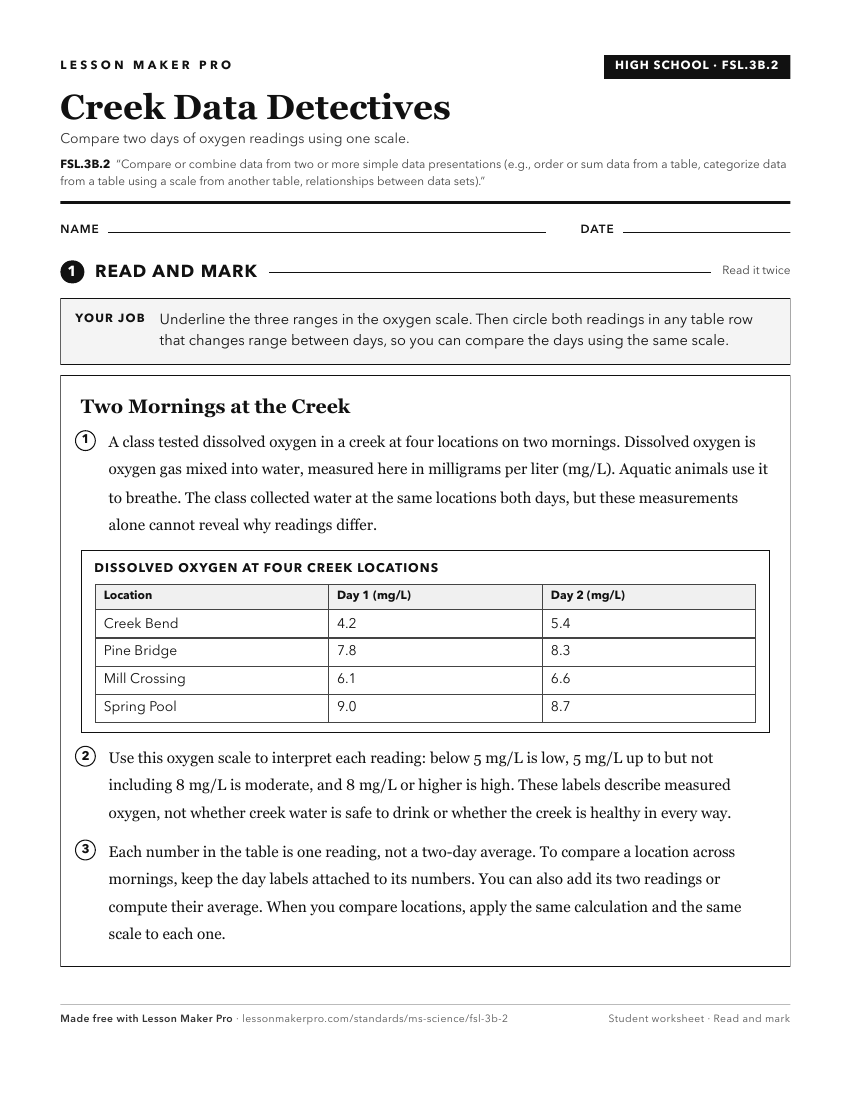
A ready-to-print activity worksheet aligned to FSL.3B.2, with an answer key for the teacher on its own page. No account needed.
PDF, US Letter, prints cleanly in black and white.
Download the worksheetKeep exploring
Related Standards
- FSL.3B.1
Analyze select data from a simple and complex data presentation (e.g., charts, graphs, diagrams).
- FSL.3A.4
Use mathematical and computational thinking to (1) use and manipulate appropriate metric units, (2) express relationships between variables for investigations, ...
- FSL.3A.2
Analyze data from simple experiments and construct organized models (e.g., data tables, graphs) detailing results from the experiments.
- FSL.3B.4
Perform a simple interpolation or simple extrapolation using data in a table or graph. Determine and/or use a simple (e.g., linear) mathematical relationship th...
Turn this exact standard into a lesson
Grade, subject, topic, and the complete standard are prefilled. Create one free, no account needed.
Also for this standard:Make a WorksheetMake a QuizMake a Sub Lesson