Mississippi Science FSL.3D
Standard Cluster
Students will apply scientific literacy and thinking skills to evaluate theoretical models, inferences, and experimental results found in various experimental designs including, but not limited to, those found in sample ACT science passages. Select the hypothesis, prediction, or conclusion that is, or is not, supported by data presentation or pieces of informational text. Determine whether given information supports or contradicts a hypothesis or conclusion and provide support for the reasoning. Analyze and interpret data from informational texts and data to (1) reveal patterns and construct meaning (2) support or refute hypotheses, explanations, claims, designs, or (3) evaluate the strength of conclusions. Use new information to make a prediction based on a theoretical model. Select and explain why a hypothesis, prediction, or conclusion is, or is not, supported by two or more data presentations or theoretical models.
2026 Mississippi College- and Career-Readiness Standards for Science · Nature of Science
Cluster contents
Standards in This Cluster
FSL.3D is a cluster heading. These are the individual standards under it.
- FSL.3D.1
Select the hypothesis, prediction, or conclusion that is, or is not, supported by data presentation or pieces of informational text.
- FSL.3D.2
Determine whether given information supports or contradicts a hypothesis or conclusion and provide support for the reasoning.
- FSL.3D.3
Analyze and interpret data from informational texts and data to (1) reveal patterns and construct meaning (2) support or refute hypotheses, explanations, claims...
- FSL.3D.4
Use new information to make a prediction based on a theoretical model.
- FSL.3D.5
Select and explain why a hypothesis, prediction, or conclusion is, or is not, supported by two or more data presentations or theoretical models.
Teacher's field guide
What This Cluster Means
What Students Need to Do
- Students read short science passages, tables, and graphs to decide which claims the evidence supports or contradicts. They compare results from two sources and use a model to predict what might happen under new conditions.
What Mastery Looks Like
- A student cites values from two data sets to explain why a claim holds up or falls short. They notice when conflicting results weaken a conclusion. They use a stated model to make a prediction when one condition changes.
Common Misconceptions
- Students may treat one trend as proof of a claim that says “always.” They may confuse a prediction with a measured result, ignore conflicting data, or assume that two variables moving together means one caused the other.
How to Assess It
- Show two results: seedlings with fertilizer grew 7 cm versus 4 cm without it in Trial A, but both groups grew 4 cm in Trial B. Ask, “Do both trials support the claim that fertilizer always increases growth? Use both results to explain.”
Lesson moves
Ways to Teach It
Fold two paper airplane designs from identical sheets, fly each three times, and test the claim that wider wings increase flight distance.
Show two graphs of enzyme activity versus temperature, one rising and one peaking; ask students to cite both when judging “hotter always means faster.”
Give pairs four claim cards and two enzyme activity graphs; score a point only when they cite a value from each graph.
Record tomorrow’s high temperatures predicted by two weather apps, check the measured high, and explain which prediction came closer.
Free download
Printable FSL.3D Worksheet
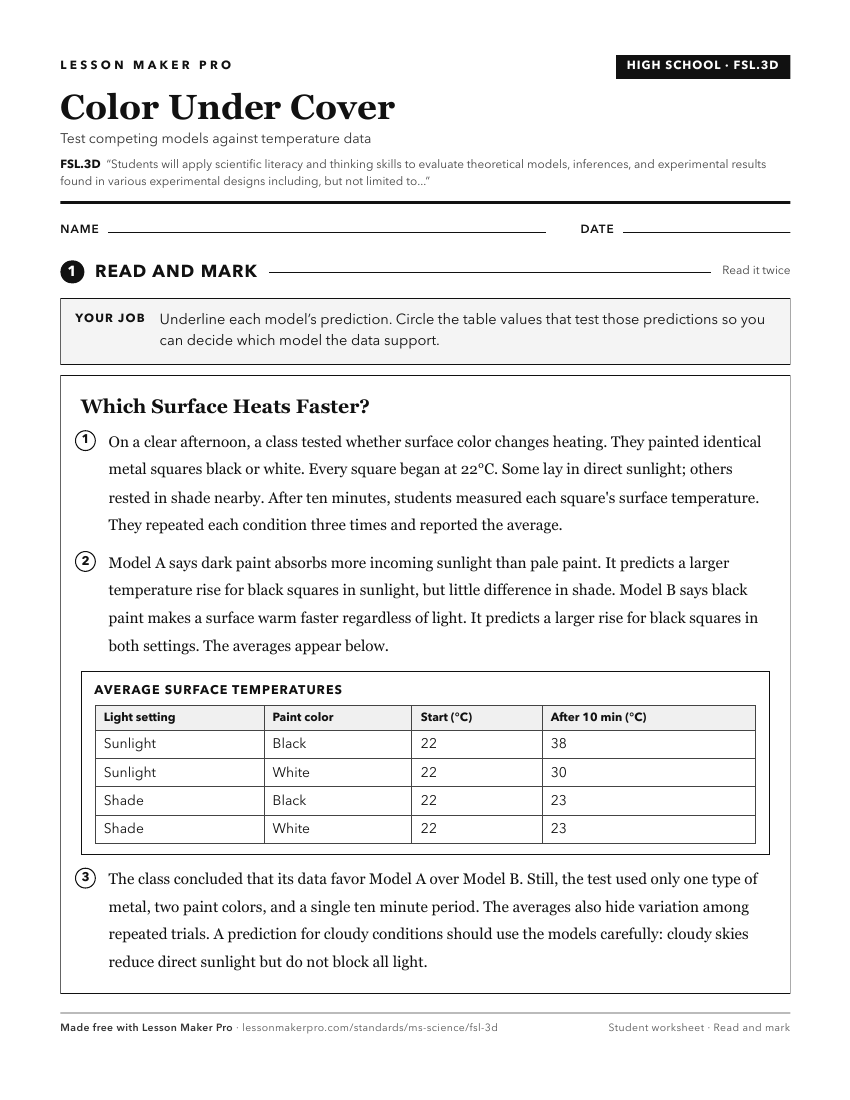
A ready-to-print activity worksheet aligned to FSL.3D, with an answer key for the teacher on its own page. No account needed.
PDF, US Letter, prints cleanly in black and white.
Download the worksheetKeep exploring
Related Standards
- FSL.3B
Students will apply scientific literacy and thinking skills to analyze and interpret data found in various graphics including, but not limited to, those found i...
- FSL.3C
Students will apply scientific literacy and thinking skills to analyze scientific investigations found in various experimental designs including, but not limite...
- PHY.1
Students will investigate and understand how to analyze and interpret data.
- FSL.3A
Students will apply science and engineering practices and skills to scientific investigations.
Turn this cluster into a lesson
Grade, subject, topic, and the complete cluster are prefilled. Create one free, no account needed.
Also for this cluster:Make a WorksheetMake a QuizMake a Sub Lesson