Mississippi Science GEN.4
Standard Cluster
Students will analyze and interpret data collected from probability calculations to explain the inheritance of traits within a population. Demonstrate Mendel’s law of dominance and segregation using mathematics to predict phenotypic and genotypic ratios. Illustrate Mendel’s law of independent assortment by analyzing multi-trait cross data sets for patterns and trends. Investigate traits that follow non-Mendelian inheritance patterns (e.g., incomplete dominance, codominance, multiple alleles, autosomal linkage, sexlinkage, polygenic, and epistasis). Construct pedigrees from observed phenotypes. Analyze and interpret data to determine patterns of inheritance and disease risk. Enrichment: Construct maps of genes on a chromosome based on data obtained from 2- and/or 3-point crosses or from recombination frequencies.
2026 Mississippi College- and Career-Readiness Standards for Science · Classic Mendelian Genetics
Cluster contents
Standards in This Cluster
GEN.4 is a cluster heading. These are the individual standards under it.
- GEN.4.1
Demonstrate Mendel’s law of dominance and segregation using mathematics to predict phenotypic and genotypic ratios.
- GEN.4.2
Illustrate Mendel’s law of independent assortment by analyzing multi-trait cross data sets for patterns and trends.
- GEN.4.3
Investigate traits that follow non-Mendelian inheritance patterns (e.g., incomplete dominance, codominance, multiple alleles, autosomal linkage, sexlinkage, pol...
- GEN.4.4
Construct pedigrees from observed phenotypes. Analyze and interpret data to determine patterns of inheritance and disease risk.
- GEN.4.5
Enrichment: Construct maps of genes on a chromosome based on data obtained from 2- and/or 3-point crosses or from recombination frequencies.
Teacher's field guide
What This Cluster Means
What Students Need to Do
- Students use probability to predict allele pairs and visible traits in offspring, including crosses with two traits. They compare predictions with offspring counts and use family histories to identify inheritance patterns and estimate disease risk.
What Mastery Looks Like
- A student can predict a 1:2:1 allele-pair ratio and a 3:1 trait ratio for a cross of two carriers, then compare those ratios with actual counts. They can explain when the counts do not fit simple dominance or independent assortment. They can draw a pedigree from a family history and calculate a child's risk when both parents are carriers.
Common Misconceptions
- Students may think a 3:1 ratio means exactly three of every four children will show a trait. They may confuse dominant with common or assume two traits always sort separately. They may mistake an affected person on a pedigree for an unaffected carrier.
How to Assess It
- Exit ticket: Two Aa parents have four children. Give the expected allele-pair and trait ratios, then explain whether exactly three children must show the dominant trait.
Lesson moves
Ways to Teach It
Label both coins A on one side and a on the other; flip them 40 times and compare AA, Aa, and aa counts.
Ask students to explain in writing why red and white flowers might produce pink offspring rather than all red offspring.
Give pairs A/a and B/b allele cards; students list gametes for AaBb parents and test predicted offspring traits against 9:3:3:1.
Give students a fictional family history; they draw a pedigree and calculate a child's recessive disease risk for two carrier parents.
Free download
Printable GEN.4 Worksheet
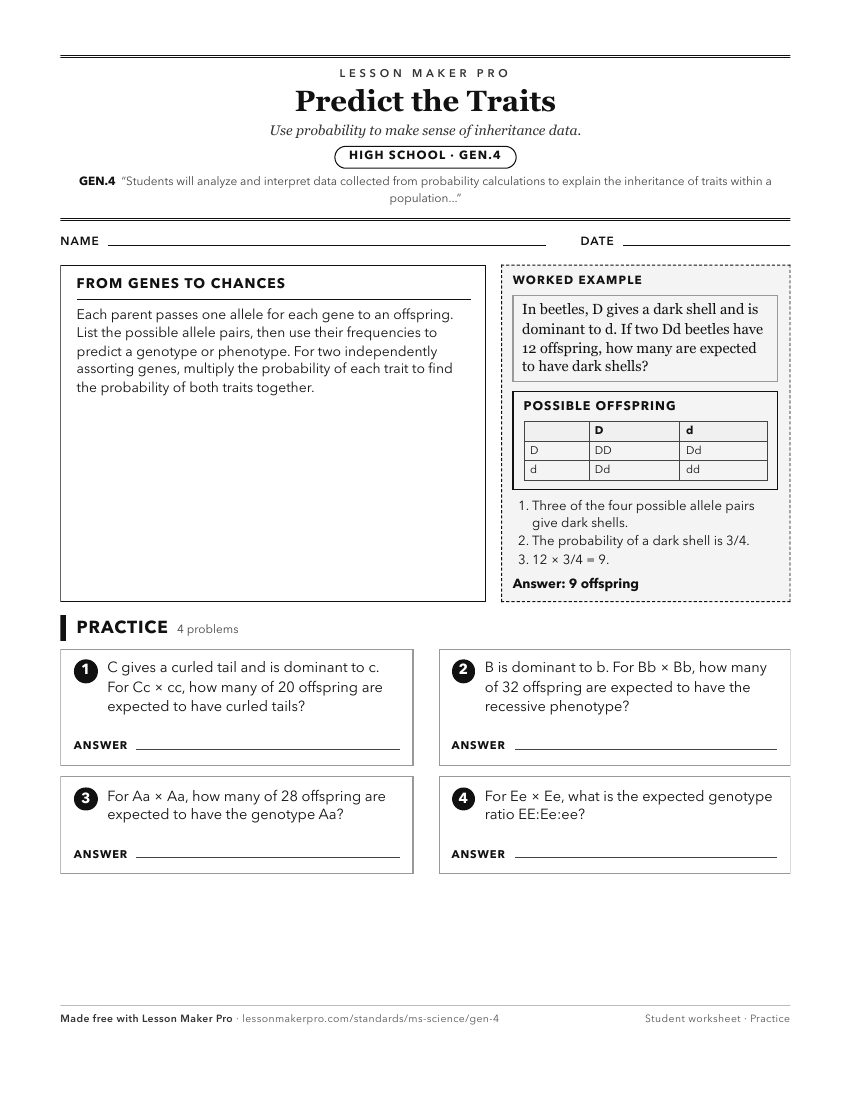
A ready-to-print activity worksheet aligned to GEN.4, with an answer key for the teacher on its own page. No account needed.
PDF, US Letter, prints cleanly in black and white.
Download the worksheetKeep exploring
Related Standards
- BIO.3B
Students will analyze and interpret data collected from probability calculations to explain the variation of expressed traits within a population.
- FB.4.3
Use models (e.g., Punnett squares) and mathematical reasoning to describe and predict patterns of inheritance of single genetic traits from parents to offspring...
- GEN.5
Students will apply population genetic concepts to explain the variability of organisms within a population.
- BIO.3B.4
Analyze and interpret data (e.g., pedigrees, family, and population studies) regarding Mendelian and complex genetic traits (e.g., sickle-cell anemia, cystic fi...
Turn this cluster into a lesson
Grade, subject, topic, and the complete cluster are prefilled. Create one free, no account needed.
Also for this cluster:Make a WorksheetMake a QuizMake a Sub Lesson