Mississippi Science BIO.3B
Standard Cluster
Students will analyze and interpret data collected from probability calculations to explain the variation of expressed traits within a population. Demonstrate Mendel’s law of dominance and segregation using mathematics to predict phenotypic and genotypic ratios by constructing Punnett squares with both homozygous and heterozygous allele pairs. Apply Mendel’s law of independent assortment to interpret dihybrid crosses. Investigate traits that follow non-Mendelian inheritance patterns (e.g., incomplete dominance, codominance, multiple alleles in human blood types, and sex-linkage). Analyze and interpret data (e.g., pedigrees, family, and population studies) regarding Mendelian and complex genetic traits (e.g., sickle-cell anemia, cystic fibrosis, muscular dystrophy, color-blindness, and hemophilia) to determine patterns of inheritance and disease risk.
2026 Mississippi College- and Career-Readiness Standards for Science · Reproduction and Heredity
Cluster contents
Standards in This Cluster
BIO.3B is a cluster heading. These are the individual standards under it.
- BIO.3B.1
Demonstrate Mendel’s law of dominance and segregation using mathematics to predict phenotypic and genotypic ratios by constructing Punnett squares with both hom...
- BIO.3B.2
Apply Mendel’s law of independent assortment to interpret dihybrid crosses.
- BIO.3B.3
Investigate traits that follow non-Mendelian inheritance patterns (e.g., incomplete dominance, codominance, multiple alleles in human blood types, and sex-linka...
- BIO.3B.4
Analyze and interpret data (e.g., pedigrees, family, and population studies) regarding Mendelian and complex genetic traits (e.g., sickle-cell anemia, cystic fi...
Teacher's field guide
What This Cluster Means
What Students Need to Do
- Students use Punnett squares and probability to predict offspring genotypes and traits for one-gene and two-gene crosses. They compare predictions with offspring counts and use pedigrees to estimate disease risk. They also work with blood types, sex-linked traits, and traits that do not follow simple dominance.
What Mastery Looks Like
- They show that AA × Aa gives half AA and half Aa offspring, all with the dominant trait. For AaBb × AaBb, they find the 9:3:3:1 trait ratio when the genes assort independently. They use a pedigree to estimate disease risk and explain why actual counts can differ from predicted ratios.
Common Misconceptions
- Students often think dominant means common, or that a 25% risk guarantees exactly one affected child in four births. They may assume two genes always pass together. They may call a blended trait codominance or overlook sex chromosomes when reading a pedigree.
How to Assess It
- Exit ticket: For Aa × Aa, where A is dominant, give genotype and trait probabilities. Explain why 12 offspring might not match the predicted trait ratio.
Lesson moves
Ways to Teach It
Label both coins A on heads and a on tails; flip 40 pairs for an Aa × Aa cross and compare genotypes with predictions.
Show a pedigree with two unaffected parents and a child with cystic fibrosis; ask, "What inheritance pattern fits, and why?"
Give pairs AB, Ab, aB, and ab cards for each parent; race to complete an AaBb × AaBb Punnett square and tally traits.
Use a fictional maternity record listing one AB parent and one O parent; ask which blood types their child could have.
Free download
Printable BIO.3B Worksheet
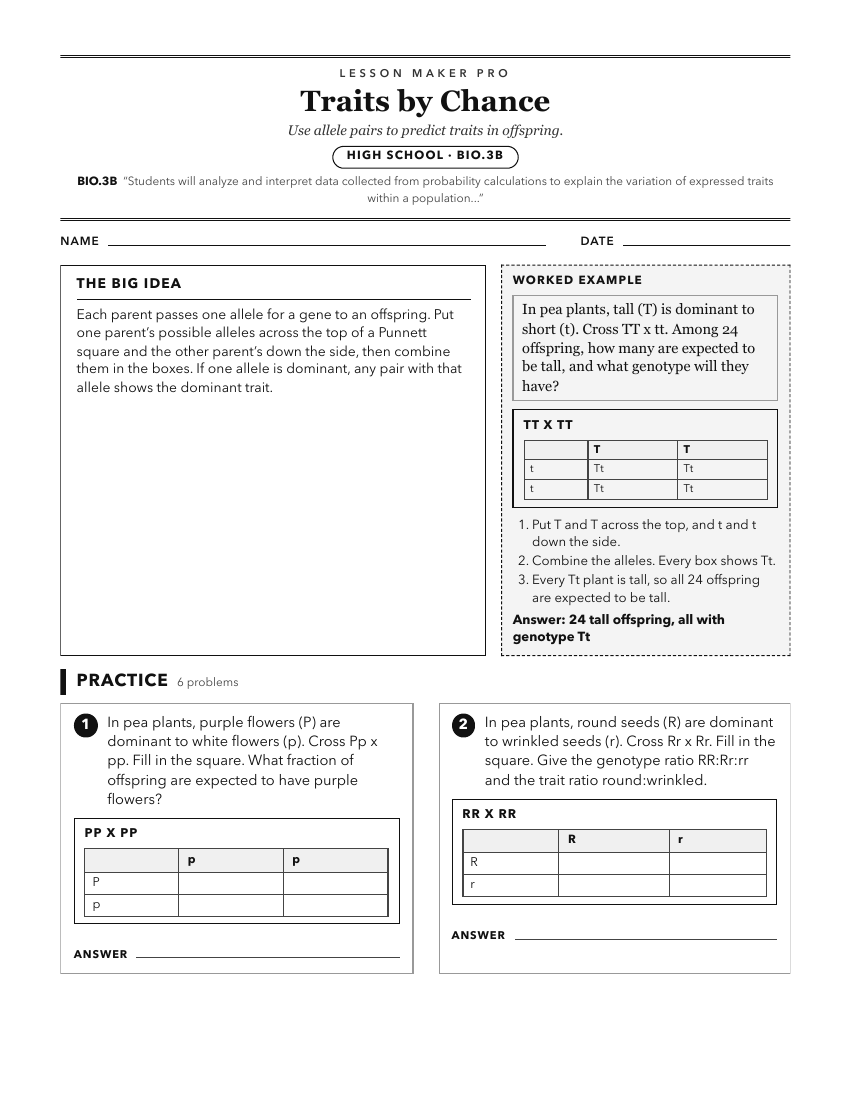
A ready-to-print activity worksheet aligned to BIO.3B, with an answer key for the teacher on its own page. No account needed.
PDF, US Letter, prints cleanly in black and white.
Download the worksheetKeep exploring
Related Standards
- L.8.4B.1
Analyze and interpret data (e.g., pictures, graphs) to explain how natural selection may lead to increases and decreases in specific traits in populations over ...
- PHY.1
Students will investigate and understand how to analyze and interpret data.
- GEN.4
Students will analyze and interpret data collected from probability calculations to explain the inheritance of traits within a population.
- GEN.5
Students will apply population genetic concepts to explain the variability of organisms within a population.
Turn this cluster into a lesson
Grade, subject, topic, and the complete cluster are prefilled. Create one free, no account needed.
Also for this cluster:Make a WorksheetMake a QuizMake a Sub Lesson