Mississippi Science MAQ.2
Standard Cluster
Students will develop an understanding of the principles of fluid dynamics as it relates to both salt and freshwater systems. Characterize wave features and wave properties, including wavelength, period, wave speed, breakers, and constructive waves and their effects on shoreline communities (e.g., headlands, embayments, shoreline erosion, and deposition). Survey predictable patterns of tides (i.e., tidal period and range, diurnal, semidiurnal, mixed, spring, and neap tides) to correlate with moon phases in graphical form. Summarize principles related to currents (e.g., global wind patterns, Coriolis effect, Ekman spiral, surface, thermohaline, upwelling, downwelling, El Niño, La Niña, hurricanes, Barrier Island movement). Research, analyze, and communicate scientific arguments to support climate models that predict how global and regional climate change can affect Earth’s systems (e.g., precipitation and temperature and their associated impacts on sea level, global ice volumes, and atmosphere and ocean composition). Distinguish between lentic and lotic water systems, including water flow, seasonal overturn, and watershed mapping.
2026 Mississippi College- and Career-Readiness Standards for Science · Fluid Dynamics
Cluster contents
Standards in This Cluster
MAQ.2 is a cluster heading. These are the individual standards under it.
- MAQ.2.1
Characterize wave features and wave properties, including wavelength, period, wave speed, breakers, and constructive waves and their effects on shoreline commun...
- MAQ.2.2
Survey predictable patterns of tides (i.e., tidal period and range, diurnal, semidiurnal, mixed, spring, and neap tides) to correlate with moon phases in graphi...
- MAQ.2.3
Summarize principles related to currents (e.g., global wind patterns, Coriolis effect, Ekman spiral, surface, thermohaline, upwelling, downwelling, El Niño, La ...
- MAQ.2.4
Research, analyze, and communicate scientific arguments to support climate models that predict how global and regional climate change can affect Earth’s systems...
- MAQ.2.5
Distinguish between lentic and lotic water systems, including water flow, seasonal overturn, and watershed mapping.
Teacher's field guide
What This Cluster Means
What Students Need to Do
- Students measure waves and predict where shorelines lose or gain sand. They read tide graphs and explain how wind, Earth’s rotation, and water density move ocean water. They map water flow through lakes and streams and use climate projections to explain changes along coasts.
What Mastery Looks Like
- Given a wave diagram, students find wavelength and period, calculate wave speed, and explain where a breaker may erode sand. They identify daily tide patterns and match large and small tidal ranges to moon phases. They use current and watershed maps to explain water movement and cite a climate graph to support a coastal prediction.
Common Misconceptions
- Students may confuse wave height with wavelength or think spring tides happen only in spring. They may assume every coast has two equal high tides each day. Some think all currents come from wind or treat lakes and streams as if water moves through them the same way.
How to Assess It
- Show a 24-hour tide graph with two similar high tides, two low tides, and a large range, labeled “new moon.” Ask students to name the daily tide pattern, identify spring or neap tide, and cite evidence for each answer.
Lesson moves
Ways to Teach It
Send waves across a sand-lined tray with a ruler; time passing crests and mark where sand erodes or builds up.
Give pairs projected temperature and sea-level graphs; ask, “What shoreline change do these models predict, and which data support your claim?”
Sort tide-curve cards into diurnal, semidiurnal, and mixed piles, then match large and small ranges to moon-phase cards.
On a local watershed map, label a pond and stream, then trace rainwater to the coast and along a mapped current.
Free download
Printable MAQ.2 Worksheet
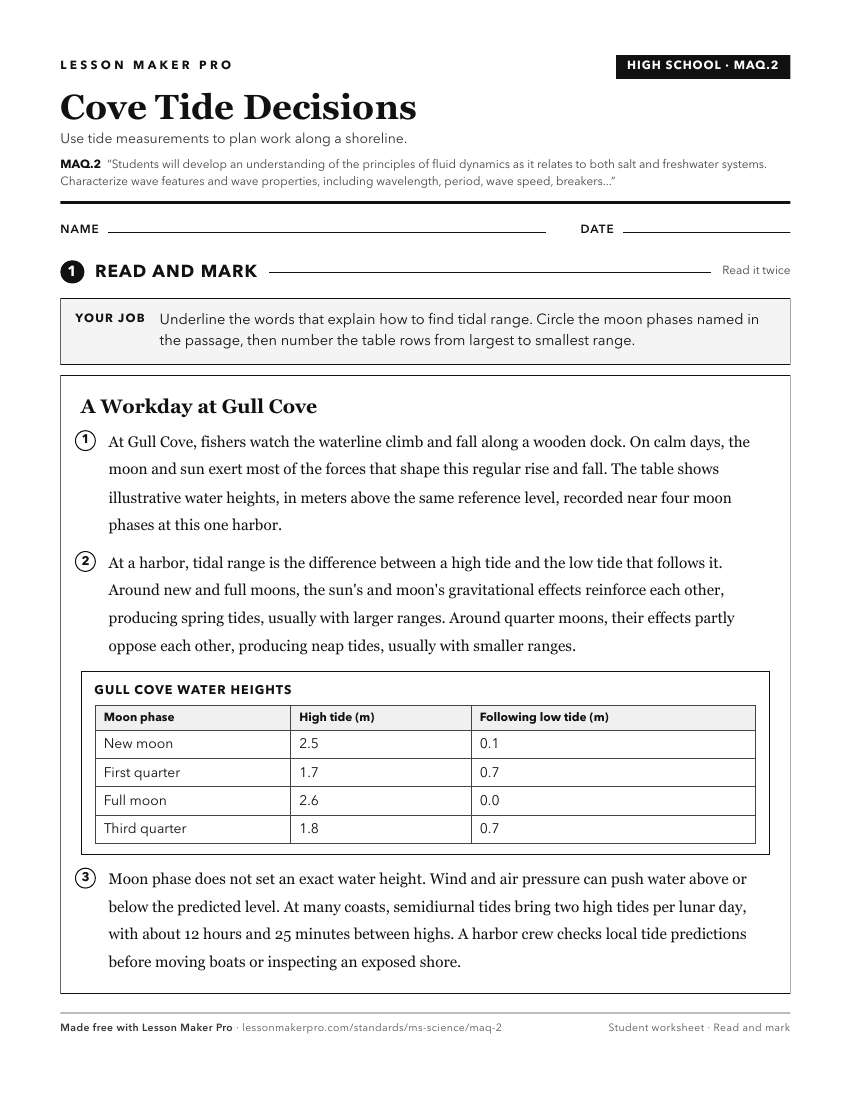
A ready-to-print activity worksheet aligned to MAQ.2, with an answer key for the teacher on its own page. No account needed.
PDF, US Letter, prints cleanly in black and white.
Download the worksheetKeep exploring
Related Standards
- PHY.2
Students will develop an understanding of concepts related to Newtonian dynamics.
- E.1.10
Students will demonstrate an understanding of human dependence on clean and renewable water resources
- ESS.3
Students will develop an understanding of Earth’s systems and cycles.
- MAQ.1
Students will develop an understanding of the unique physical and chemical properties of water and how those properties shape life on Earth.
Turn this cluster into a lesson
Grade, subject, topic, and the complete cluster are prefilled. Create one free, no account needed.
Also for this cluster:Make a WorksheetMake a QuizMake a Sub Lesson