Mississippi Science MAQ.2.4
The Standard
- MAQ.2
- Students will develop an understanding of the principles of fluid dynamics as it relates to both salt and freshwater systems.
Research, analyze, and communicate scientific arguments to support climate models that predict how global and regional climate change can affect Earth’s systems (e.g., precipitation and temperature and their associated impacts on sea level, global ice volumes, and atmosphere and ocean composition).
2026 Mississippi College- and Career-Readiness Standards for Science · Fluid Dynamics
Teacher's field guide
What This Standard Means
What Students Need to Do
- Students find climate model projections and compare them with observed temperature and rainfall records. They use the patterns to explain possible changes in sea level, ice, and ocean or air composition. They make a claim and back it with evidence.
What Mastery Looks Like
- A student can tell a model projection from a measurement and identify trends they share. They can explain how warming water and melting land ice affect sea level, using numbers from a graph to support a claim. They can name a reason a regional prediction may be uncertain.
Common Misconceptions
- Students may treat one storm as proof that a climate model is wrong. They may think melting floating sea ice raises sea level as much as melting land ice. They may miss that warmer seawater expands even without added meltwater.
How to Assess It
- Exit ticket: A regional model projects 2°C of warming and 15% more rainfall by 2050. Name one likely coastal impact, cite a number from the projection, and name an observation that could test your claim.
Lesson moves
Ways to Teach It
Mark water levels in two clear cups, then melt floating ice in one and ice on a clay landmass above the water in the other.
Show a NOAA sea level projection and a tide gauge record; ask students to write which trend agrees and one possible source of uncertainty.
Hand out cards labeled temperature, rainfall, land ice, ocean heat, and sea level; teams arrange cause-and-effect chains and defend one link.
Use a coastal city's NOAA sea level projection and an elevation map to identify roads that could flood more often.
Free download
Printable MAQ.2.4 Worksheet
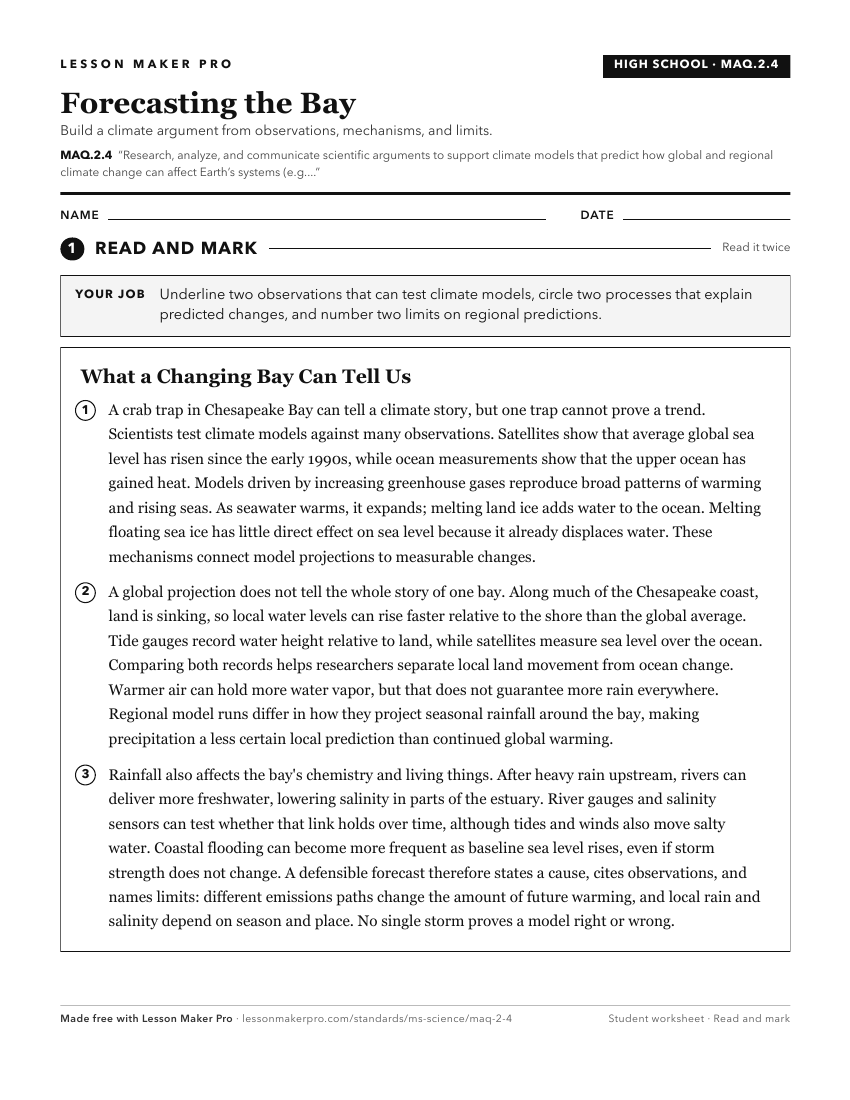
A ready-to-print activity worksheet aligned to MAQ.2.4, with an answer key for the teacher on its own page. No account needed.
PDF, US Letter, prints cleanly in black and white.
Download the worksheetKeep exploring
Related Standards
- E.7.9B.1
Read and evaluate scientific or technical information assessing the evidence and bias of each source to explain the causes and effects of climate change.
- MAQ.4.6
Research, analyze, and communicate the effects of natural phenomena (e.g., hurricanes, floods, drought, and sea-level rise) on the aquatic ecosystems.
- ESS.3.6
Construct an explanation from data sets to obtain and evaluate scientific information to construct scientific arguments on changes in climate caused by various ...
- ENV.3.2
Interpret data and climate models to predict how global and regional climate change can affect Earth’s systems (e.g., precipitation, temperature, impacts on sea...
Turn this exact standard into a lesson
Grade, subject, topic, and the complete standard are prefilled. Create one free, no account needed.
Also for this standard:Make a WorksheetMake a QuizMake a Sub Lesson