Mississippi Science ESS.3.6
The Standard
- ESS.3
- Students will develop an understanding of Earth’s systems and cycles.
Construct an explanation from data sets to obtain and evaluate scientific information to construct scientific arguments on changes in climate caused by various natural factors (e.g., plate tectonics and continent location and Milankovitch cycles) versus anthropogenic factors (e.g., fossil fuel use and agricultural factors).
2026 Mississippi College- and Career-Readiness Standards for Science · Earth’s Systems and Cycles
Teacher's field guide
What This Standard Means
What Students Need to Do
- Students compare temperature records with data on orbital cycles, continent positions, greenhouse gases, and human activity. They use timing and rates to argue which factors explain a climate change. They check where the data came from.
What Mastery Looks Like
- A student can cite dates and values from at least two data sets to support a claim. They can explain why continental shifts and orbital cycles are too slow to explain recent warming. They can also name what a graph alone cannot prove.
Common Misconceptions
- Students may assume orbital cycles or moving continents explain warming over a century, though both act over much longer periods. They may treat matching CO2 and temperature curves as proof by themselves, without checking emissions data.
How to Assess It
- Exit ticket: CO2 rose from about 290 ppm in 1880 to 414 ppm in 2020, while global temperature rose about 1°C. Orbital cycles take tens of thousands of years. Which cause best fits the timing, and what emissions data would help test your claim?
Lesson moves
Ways to Teach It
Lay out two tape timelines, one for 150 years and one for 100,000 years, then place climate-driver cards on each.
Show recent and ancient temperature graphs, then ask: Why might orbital cycles explain ice ages but not the recent temperature rise?
Give pairs temperature, CO2, and orbital-cycle graphs; have them match each graph to a driver and defend each match with a date.
Print the local utility's fuel mix, then have students identify fuels that release CO2 and trace how those emissions affect climate.
Free download
Printable ESS.3.6 Worksheet
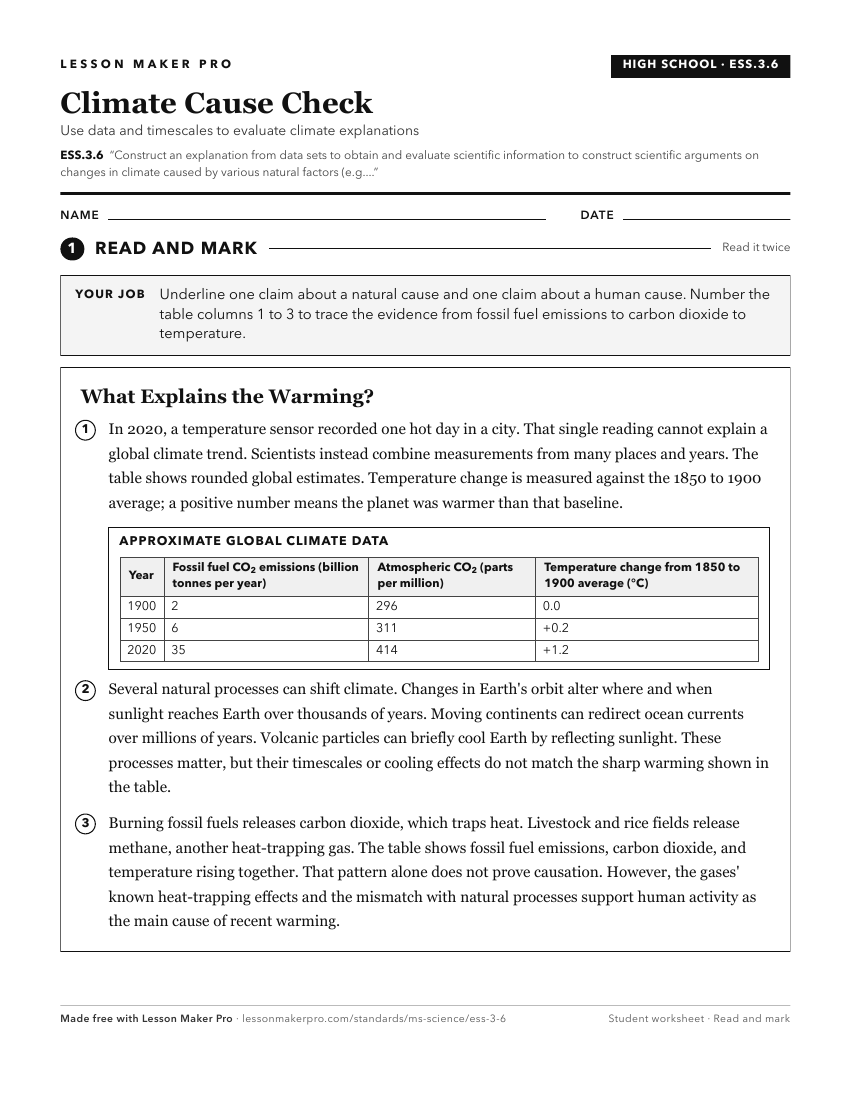
A ready-to-print activity worksheet aligned to ESS.3.6, with an answer key for the teacher on its own page. No account needed.
PDF, US Letter, prints cleanly in black and white.
Download the worksheetKeep exploring
Related Standards
- BIO.5.3
Analyze and interpret quantitative data to construct an explanation for the effects of greenhouse gases on the carbon dioxide cycle and global climate.
- E.4.9B.2
Construct explanations about regional climate differences using maps and long-term data from various regions.
- E.7.9B.3
Engage in scientific argument based on current evidence to determine whether climate change happens naturally or is being accelerated through the influence of m...
- E.7.9A.4
Construct an explanation for how climate is determined in an area using global and surface features (e.g. latitude, elevation, shape of the land, distance from ...
Turn this exact standard into a lesson
Grade, subject, topic, and the complete standard are prefilled. Create one free, no account needed.
Also for this standard:Make a WorksheetMake a QuizMake a Sub Lesson