Mississippi Science E.7.9A
Standard Cluster
Students will demonstrate an understanding of how complex changes in the movement and patterns of air and water molecules caused by the sun, winds, landforms, ocean temperatures, and currents in the atmosphere are major determinants of local and global weather patterns. Analyze and interpret weather patterns from various regions to differentiate between weather and climate. Analyze evidence to explain the weather conditions that result from the relationship between the movement of water and air masses. Interpret atmospheric data from satellites, radar, and weather maps to predict weather patterns and conditions. Construct an explanation for how climate is determined in an area using global and surface features (e.g., latitude, elevation, shape of the land, distance from water, global winds, and ocean currents). Analyze models to explain the cause-and-effect relationship between solar energy and convection and the resulting weather patterns and climate conditions. Research and use models to explain what type of weather (thunderstorms, hurricanes, and tornadoes) results from the movement and interactions of air masses, high- and low-pressure systems, and frontal boundaries. Interpret topographic maps to predict how local and regional geography affect weather patterns and make them difficult to predict.
2026 Mississippi College- and Career-Readiness Standards for Science · Earth’s Systems and Cycles
Cluster contents
Standards in This Cluster
E.7.9A is a cluster heading. These are the individual standards under it.
- E.7.9A.1
Analyze and interpret weather patterns from various regions to differentiate between weather and climate.
- E.7.9A.2
Analyze evidence to explain the weather conditions that result from the relationship between the movement of water and air masses.
- E.7.9A.3
Interpret atmospheric data from satellites, radar, and weather maps to predict weather patterns and conditions.
- E.7.9A.4
Construct an explanation for how climate is determined in an area using global and surface features (e.g. latitude, elevation, shape of the land, distance from ...
- E.7.9A.5
Analyze models to explain the cause and effect relationship between solar energy and convection and the resulting weather patterns and climate conditions.
- E.7.9A.6
Research and use models to explain what type of weather (thunderstorms, hurricanes, and tornadoes) results from the movement and interactions of air masses, hig...
- E.7.9A.7
Interpret topographic maps to predict how local and regional geography affect weather patterns and make them difficult to predict.
Teacher's field guide
What This Cluster Means
What Students Need to Do
- Students read weather maps and radar images to predict rain, wind, and storms. They compare daily reports with long-term records to separate weather from climate. They explain how sunlight, moving air, oceans, and landforms affect both.
What Mastery Looks Like
- A student can use a front and pressure center on a map to predict likely weather. They use decades of data, not one storm, to describe a region's climate. They explain how uneven heating moves air and how nearby water or mountains change conditions.
Common Misconceptions
- Students may treat one hot day as proof of a hot climate. They may assume all fronts bring the same weather or that radar colors show air temperature. They may overlook how mountains change rainfall.
How to Assess It
- Draw a cold front approaching a coastal town and write, '30-year July rainfall average: 8 cm.' Ask students to predict tomorrow's weather and circle the climate evidence.
Lesson moves
Ways to Teach It
Add red warm water and blue cold water to opposite sides of a clear tub; sketch their movement and relate it to uneven heating.
Compare one hot week with a town's 30-year temperature averages; write why the hot week alone does not describe its climate.
Give pairs weather maps with fronts and pressure centers; have them place rain and wind icons, then explain each choice.
Use a local topographic map and a prevailing wind arrow to predict which mountain slope will get more rain.
Free download
Printable E.7.9A Worksheet
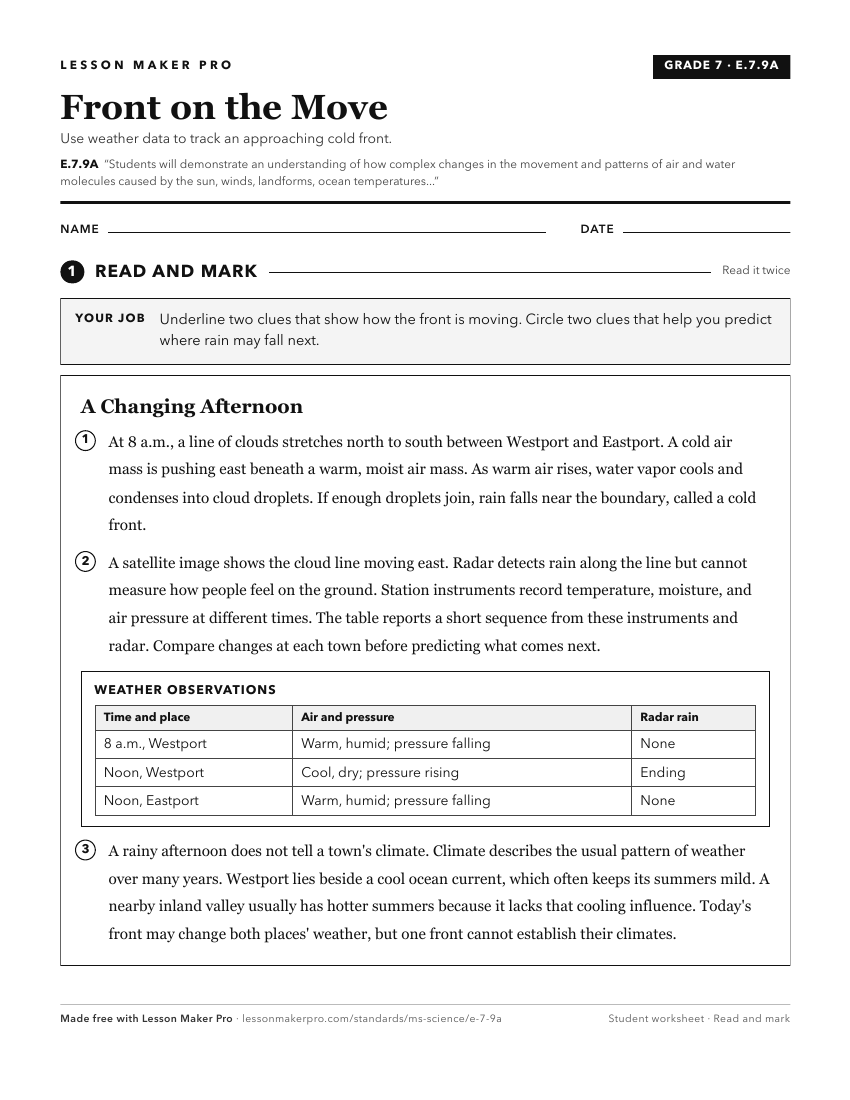
A ready-to-print activity worksheet aligned to E.7.9A, with an answer key for the teacher on its own page. No account needed.
PDF, US Letter, prints cleanly in black and white.
Download the worksheetKeep exploring
Related Standards
- E.4.9B
Students will demonstrate an understanding of weather and climate patterns.
- E.1.9A
Students will demonstrate an understanding of the patterns of weather by describing, recording, and analyzing weather data to answer questions about daily and s...
- E.K.8A
Students will demonstrate an understanding of the pattern of seasonal changes on the Earth.
- E.7.9B
Students will demonstrate an understanding of the relationship between natural phenomena, human activity, and global climate change.
Turn this cluster into a lesson
Grade, subject, topic, and the complete cluster are prefilled. Create one free, no account needed.
Also for this cluster:Make a WorksheetMake a QuizMake a Sub Lesson