Mississippi Science E.4.9B
Standard Cluster
Students will demonstrate an understanding of weather and climate patterns. Analyze and interpret data (e.g., temperature, precipitation, wind speed/direction, relative humidity, or cloud types) to predict changes in weather over time. Construct explanations about regional climate differences using maps and long-term data from various regions. Design weather instruments utilized to measure weather conditions (e.g., barometer, hygrometer, rain gauge, anemometer, or wind vane). Use an engineering design process to define the problem, design, construct, evaluate, and improve the weather instrument. *
2026 Mississippi College- and Career-Readiness Standards for Science · Earth’s Systems and Cycles
Cluster contents
Standards in This Cluster
E.4.9B is a cluster heading. These are the individual standards under it.
- E.4.9B.1
Analyze and interpret data (e.g., temperature, precipitation, wind speed/direction, relative humidity, or cloud types) to predict changes in weather over time.
- E.4.9B.2
Construct explanations about regional climate differences using maps and long-term data from various regions.
- E.4.9B.3
Design weather instruments utilized to measure weather conditions (e.g., barometer, hygrometer, rain gauge, anemometer, or wind vane). Use an engineering design...
Teacher's field guide
What This Cluster Means
What Students Need to Do
- Students use several days of temperature, rain, wind, and cloud records to predict the next day's weather. They use maps and records from many years to explain why regions have different climates. They design, build, test, and improve a tool that measures weather.
What Mastery Looks Like
- Students make a weather prediction and point to the data behind it. They use a map and long-term records to explain a climate difference between two regions. Their weather tool gives a readable measurement, and they can explain what they changed after testing it.
Common Misconceptions
- Students may call a place rainy because it rained there once, or assume clouds always mean rain. They may build a rain gauge without testing it or put the zero mark above the bottom of the jar.
How to Assess It
- Give students this chart: Monday, sunny with 0 mm of rain; Tuesday, cloudy with 2 mm; Wednesday, overcast with 8 mm. Ask, "What weather might Thursday bring? Use two details from the chart to explain."
Lesson moves
Ways to Teach It
Challenge pairs to build a readable rain gauge from a clear jar and ruler, test it with measured water, then fix one flaw.
Show 30-year rainfall averages and a map for Seattle and Phoenix; ask how location helps explain their different rainfall.
Give teams three daily weather cards showing temperature, wind, and clouds; have them predict day four and cite two clues.
Compare the class rain gauge's daily readings with the local forecast for a week; write where they agreed or differed.
Free download
Printable E.4.9B Worksheet
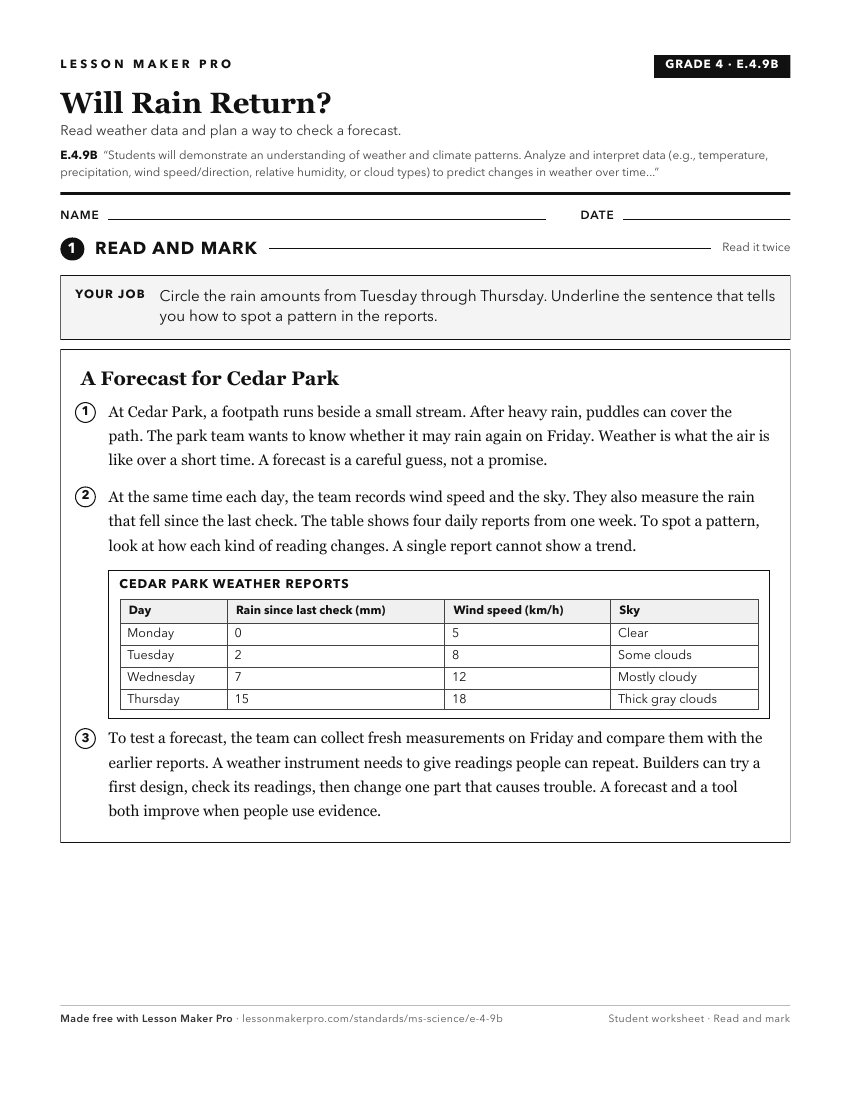
A ready-to-print activity worksheet aligned to E.4.9B, with an answer key for the teacher on its own page. No account needed.
PDF, US Letter, prints cleanly in black and white.
Download the worksheetKeep exploring
Related Standards
- E.7.9A
Students will demonstrate an understanding of how complex changes in the movement and patterns of air and water molecules caused by the sun, winds, landforms, o...
- E.1.9A
Students will demonstrate an understanding of the patterns of weather by describing, recording, and analyzing weather data to answer questions about daily and s...
- E.K.8A
Students will demonstrate an understanding of the pattern of seasonal changes on the Earth.
- E.7.9B
Students will demonstrate an understanding of the relationship between natural phenomena, human activity, and global climate change.
Turn this cluster into a lesson
Grade, subject, topic, and the complete cluster are prefilled. Create one free, no account needed.
Also for this cluster:Make a WorksheetMake a QuizMake a Sub Lesson