Florida B.E.S.T. MA.912.F.1
B.E.S.T. Standard (Benchmark Cluster)
Understand, compare and analyze properties of functions.
Florida B.E.S.T. Standards for Mathematics
Cluster contents
Benchmarks in This Standard
MA.912.F.1 is a B.E.S.T. standard. These are the benchmarks under it.
- MA.912.F.1.1
Given an equation or graph that defines a function, determine the function type. Given an input-output table, determine a function type that could represent it.
- MA.912.F.1.2
Given a function represented in function notation, evaluate the function for an input in its domain. For a real-world context, interpret the output.
- MA.912.F.1.3
Calculate and interpret the average rate of change of a real-world situation represented graphically, algebraically or in a table over a specified interval.
- MA.912.F.1.4
Write an algebraic expression that represents the difference quotient of a function. Calculate the numerical value of the difference quotient at a given pair of...
- MA.912.F.1.5
Compare key features of linear functions each represented algebraically, graphically, in tables or written descriptions.
- MA.912.F.1.6
Compare key features of linear and nonlinear functions each represented algebraically, graphically, in tables or written descriptions.
- MA.912.F.1.7
Compare key features of two functions each represented algebraically, graphically, in tables or written descriptions.
- MA.912.F.1.8
Determine whether a linear, quadratic or exponential function best models a given real-world situation.
- MA.912.F.1.9
Determine whether a function is even, odd or neither when represented algebraically, graphically or in a table.
Teacher's field guide
What This Cluster Means
What Students Need to Do
- Students describe how a function behaves from its graph, table, equation, or context. They compare functions using features such as domain, range, intercepts, rate of change, extrema, and end behavior.
What Mastery Looks Like
- Students move between graphs, tables, equations, and verbal descriptions. They accurately compare domain, range, intercepts, rates of change, intervals of increase or decrease, and end behavior.
Common Misconceptions
- Students confuse domain with range and x-intercepts with y-intercepts. They may treat a graph as a picture instead of reading intervals, rates, and key points. They also assume every function is linear or that a steeper graph always has larger values.
How to Assess It
- Give students a graph of f and a table for g. Ask them to identify each function’s domain, compare initial values, and state where f(x) is greater than g(x).
Lesson moves
Ways to Teach It
Build graphs with string and sticky notes, then label intercepts, increasing intervals, maximums, minimums, domain, and range.
Show two function graphs and ask, “Which function grows faster, and what evidence from the graphs supports your claim?”
Run a card sort matching equations, tables, graphs, and descriptions of the same functions, then have teams justify each match.
Compare two phone plans using tables and graphs, then decide which plan costs less for different monthly data amounts.
Free download
Printable MA.912.F.1 Worksheet
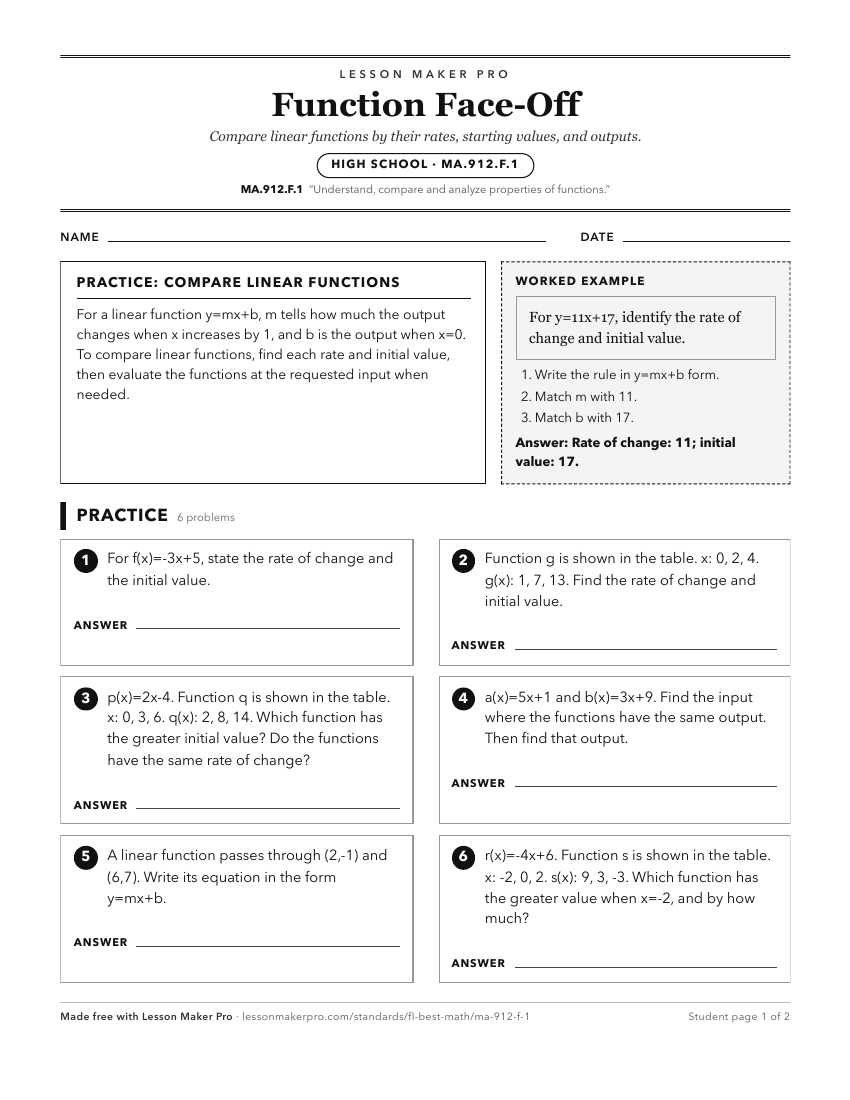
A ready-to-print activity worksheet aligned to MA.912.F.1, with an answer key for the teacher on its own page. No account needed.
PDF, US Letter, prints cleanly in black and white.
Download the worksheetKeep exploring
Related Standards
Turn this cluster into a lesson
Grade, subject, topic, and the complete cluster are prefilled. Create one free, no account needed.
Also for this cluster:Make a WorksheetMake a QuizMake a Sub Lesson