Florida B.E.S.T. MA.912.F.1.7
The Standard
Compare key features of two functions each represented algebraically, graphically, in tables or written descriptions.
Florida B.E.S.T. Standards for Mathematics
Teacher's field guide
What This Standard Means
What Students Need to Do
- Students identify intercepts, domain, range, intervals of increase or decrease, extrema, and rates of change. They compare those features across equations, graphs, tables, and verbal descriptions, then support each claim with evidence.
What Mastery Looks Like
- Given two functions in different forms, students accurately find matching features and compare values or rates over a specified interval. They cite coordinates, table values, equation terms, or description details as evidence.
Common Misconceptions
- Students may compare visual height or equation coefficients without checking scale, domain, or function type. They often confuse x-intercepts with y-intercepts, treat listed table values as the full domain and range, or assume average rate is constant.
How to Assess It
- Exit ticket: Function A is f(x) = 2x - 3. Function B passes through (0, 1), (1, 2), and (2, 3). Compare their y-intercepts and rates of change, then justify each answer.
Lesson moves
Ways to Teach It
Give groups equation, graph, table, and description cards to match, then label intercepts, extrema, domain, range, and rate of change.
Display a graph and a table, then ask, “Which function grows faster, and what evidence proves it?”
Play Feature Faceoff: reveal two function cards, name a requested feature, and award a point for the first correct, justified comparison.
Compare two phone plans shown by an equation and a table, then identify starting cost, monthly rate, and when one becomes cheaper.
Free download
Printable MA.912.F.1.7 Worksheet
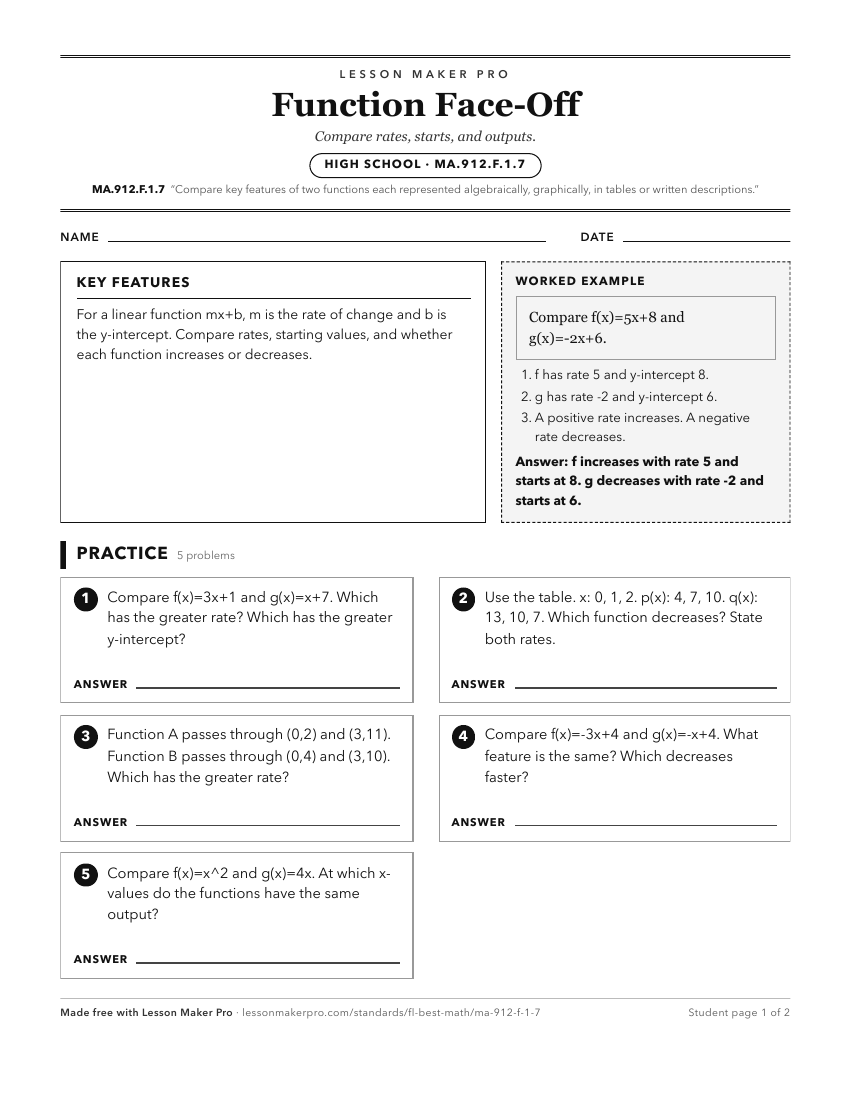
A ready-to-print activity worksheet aligned to MA.912.F.1.7, with an answer key for the teacher on its own page. No account needed.
PDF, US Letter, prints cleanly in black and white.
Download the worksheetKeep exploring
Related Standards
- MA.912.AR.8.2
Given a table, equation or written description of a rational function, graph that function and determine its key features.
- MA.912.AR.4.3
Given a table, equation or written description of an absolute value function, graph that function and determine its key features.
- MA.912.F.1.5
Compare key features of linear functions each represented algebraically, graphically, in tables or written descriptions.
- MA.912.F.1.6
Compare key features of linear and nonlinear functions each represented algebraically, graphically, in tables or written descriptions.
Turn this exact standard into a lesson
Grade, subject, topic, and the complete standard are prefilled. Create one free, no account needed.
Also for this standard:Make a WorksheetMake a QuizMake a Sub Lesson