Florida B.E.S.T. MA.912.F.1.5
The Standard
Compare key features of linear functions each represented algebraically, graphically, in tables or written descriptions.
Florida B.E.S.T. Standards for Mathematics
Teacher's field guide
What This Standard Means
What Students Need to Do
- Students identify slope, y-intercept, and whether a linear function increases or decreases, regardless of how it is shown. They compare functions using those features and support conclusions with values or calculations.
What Mastery Looks Like
- A student can find slope and y-intercept from an equation, graph, table, or description. The student can compare two functions and support each claim with correct values or calculations.
Common Misconceptions
- Students may calculate slope as y divided by x instead of using changes in y and x. They may confuse the y-intercept with an x-value or overlook graph scale. They may also think a line that looks steeper always has the greater slope.
How to Assess It
- Give students f(x) = 3x - 4 and a table with points (0, 1), (2, 5), and (4, 9). Ask which function has the greater rate of change, which has the greater initial value, and how they know.
Lesson moves
Ways to Teach It
Give groups equation, graph, table, and description cards, then have them match equivalent functions and label each slope and y-intercept.
Post two representations and ask students to write which starts higher, which changes faster, and what evidence proves each claim.
Play Function Face-Off: pairs draw two function cards, compare a named feature, and earn a point for a correct explanation.
Compare two taxi fares using a fee equation and a rate table, then decide which is cheaper for three trip distances.
Free download
Printable MA.912.F.1.5 Worksheet
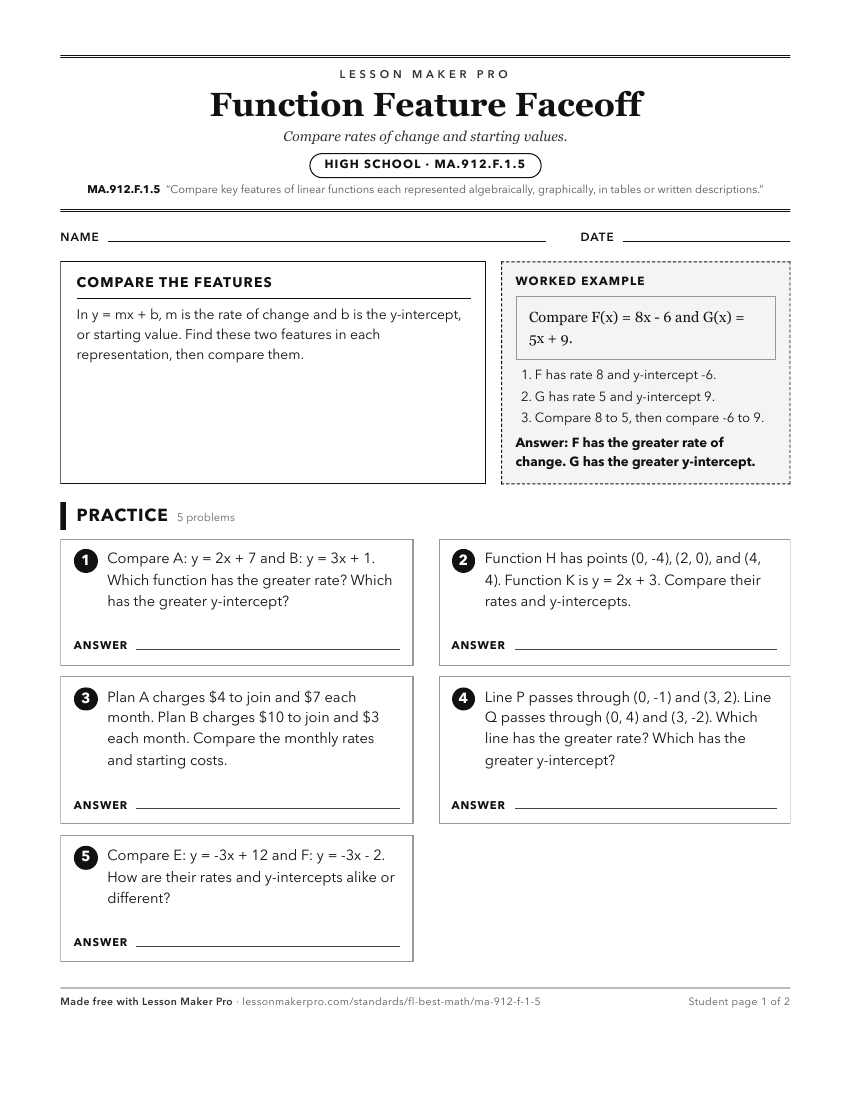
A ready-to-print activity worksheet aligned to MA.912.F.1.5, with an answer key for the teacher on its own page. No account needed.
PDF, US Letter, prints cleanly in black and white.
Download the worksheetKeep exploring
Related Standards
- MA.912.AR.4.3
Given a table, equation or written description of an absolute value function, graph that function and determine its key features.
- MA.912.F.1.7
Compare key features of two functions each represented algebraically, graphically, in tables or written descriptions.
- MA.912.AR.2.4
Given a table, equation or written description of a linear function, graph that function, and determine and interpret its key features.
- MA.912.F.1.6
Compare key features of linear and nonlinear functions each represented algebraically, graphically, in tables or written descriptions.
Turn this exact standard into a lesson
Grade, subject, topic, and the complete standard are prefilled. Create one free, no account needed.
Also for this standard:Make a WorksheetMake a QuizMake a Sub Lesson