Florida B.E.S.T. MA.912.AR.2.4
The Standard
Given a table, equation or written description of a linear function, graph that function, and determine and interpret its key features.
Florida B.E.S.T. Standards for Mathematics
Teacher's field guide
What This Standard Means
What Students Need to Do
- Students graph linear functions from tables, equations, and descriptions. They identify slope, intercepts, domain, range, and whether the function increases, decreases, or stays constant. They explain what those features mean in context.
What Mastery Looks Like
- A student chooses a sensible scale, plots accurately, and draws the correct line or segment. The student identifies key features and connects each value to the situation. Any practical limits on inputs and outputs are shown and explained.
Common Misconceptions
- Students may swap input and output values, misread the scale, or calculate slope in the wrong direction. They often confuse the two intercepts or treat the initial value as the rate. They may extend a contextual graph beyond reasonable domain and range limits.
How to Assess It
- Exit ticket: A tank starts with 30 gallons and loses 3 gallons per minute; graph its volume for 0 to 10 minutes and label both intercepts. State the slope, domain, and range, then explain each in context.
Lesson moves
Ways to Teach It
Stack 1 to 8 identical cups, measure each height, make a table and graph, then interpret the slope and intercept.
Show two linear graphs and ask students to write how different slopes and intercepts would change a matching story.
Run a card sort matching tables, equations, graphs, descriptions, and feature cards, then have pairs justify each set.
Graph a gym fee with a monthly charge plus a per-visit cost, then interpret the rate, initial value, domain, and range.
Free download
Printable MA.912.AR.2.4 Worksheet
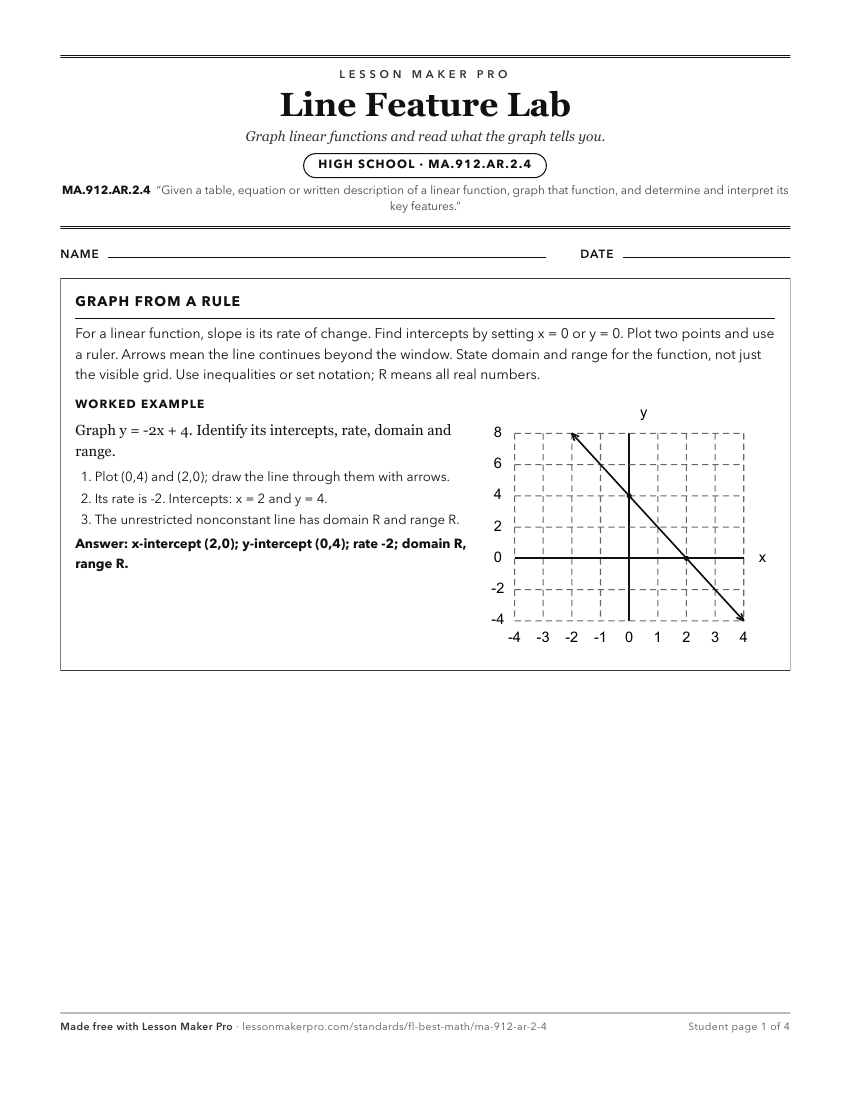
A ready-to-print activity worksheet aligned to MA.912.AR.2.4, with an answer key for the teacher on its own page. No account needed.
PDF, US Letter, prints cleanly in black and white.
Download the worksheetKeep exploring
Related Standards
- MA.912.AR.3.7
Given a table, equation or written description of a quadratic function, graph that function, and determine and interpret its key features.
- MA.912.AR.8.2
Given a table, equation or written description of a rational function, graph that function and determine its key features.
- MA.912.AR.5.6
Given a table, equation or written description of an exponential function, graph that function and determine its key features.
- MA.912.AR.4.3
Given a table, equation or written description of an absolute value function, graph that function and determine its key features.
Turn this exact standard into a lesson
Grade, subject, topic, and the complete standard are prefilled. Create one free, no account needed.
Also for this standard:Make a WorksheetMake a QuizMake a Sub Lesson