Florida B.E.S.T. MA.912.AR.5.6
The Standard
Given a table, equation or written description of an exponential function, graph that function and determine its key features.
Florida B.E.S.T. Standards for Mathematics
Teacher's field guide
What This Standard Means
What Students Need to Do
- Students create an exponential graph from an equation, table, or situation. They identify growth or decay, intercepts, domain, range, horizontal asymptote, and end behavior.
What Mastery Looks Like
- Students accurately plot points and draw a smooth exponential curve that approaches its asymptote. They identify growth or decay, intercepts, domain, range, asymptote, and end behavior from any representation.
Common Misconceptions
- Students may treat exponential change as linear and connect table points with straight segments. They may assume the asymptote is always the x-axis or confuse the base with the y-intercept.
How to Assess It
- Ask students to graph y = 3(1/2)^x - 2, then label its y-intercept, asymptote, domain, range, and end behavior.
Lesson moves
Ways to Teach It
Plot y = 2^x for integer x-values with counters on a coordinate grid, then sketch the curve and mark its intercept and asymptote.
Compare y = 3(2)^x + 1 and y = 3(1/2)^x + 1, then write which features match and which differ.
Play feature-match cards by pairing equations, tables, graphs, and cards naming growth, decay, intercept, range, and asymptote.
Model phone resale value with V = 800(0.75)^t, graph five years, and explain the intercept, decay factor, and long-term behavior.
Free download
Printable MA.912.AR.5.6 Worksheet
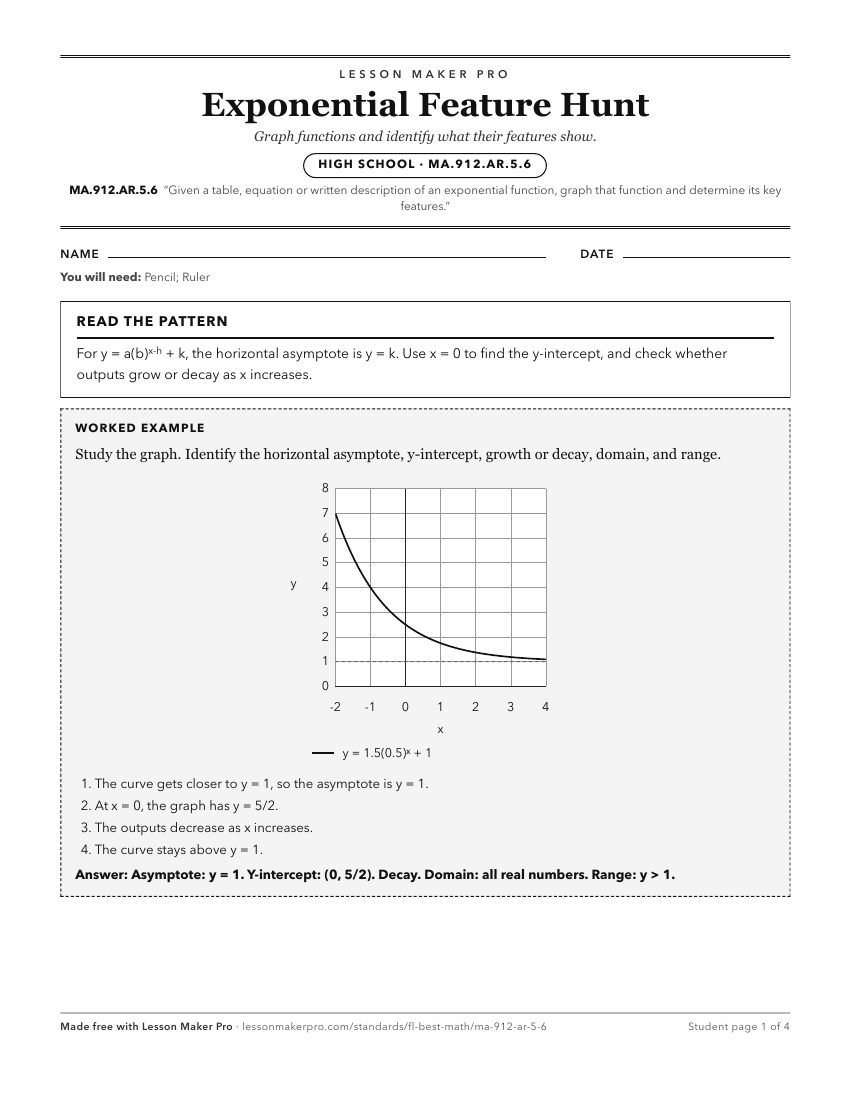
A ready-to-print activity worksheet aligned to MA.912.AR.5.6, with an answer key for the teacher on its own page. No account needed.
PDF, US Letter, prints cleanly in black and white.
Download the worksheetKeep exploring
Related Standards
- MA.912.AR.8.2
Given a table, equation or written description of a rational function, graph that function and determine its key features.
- MA.912.AR.4.3
Given a table, equation or written description of an absolute value function, graph that function and determine its key features.
- MA.912.AR.2.4
Given a table, equation or written description of a linear function, graph that function, and determine and interpret its key features.
- MA.912.AR.5.8
Given a table, equation or written description of a logarithmic function, graph that function and determine its key features.
Turn this exact standard into a lesson
Grade, subject, topic, and the complete standard are prefilled. Create one free, no account needed.
Also for this standard:Make a WorksheetMake a QuizMake a Sub Lesson