Florida B.E.S.T. MA.912.AR.5.8
The Standard
Given a table, equation or written description of a logarithmic function, graph that function and determine its key features.
Florida B.E.S.T. Standards for Mathematics
Teacher's field guide
What This Standard Means
What Students Need to Do
- Students create a logarithmic graph from an equation, table, or situation. They identify the vertical asymptote, domain, range, intercepts, direction of change, and end behavior.
What Mastery Looks Like
- Students plot accurate points and draw the curve approaching, but never crossing, its vertical asymptote. They correctly identify the domain, range, intercepts, increasing or decreasing behavior, and end behavior.
Common Misconceptions
- Students may use inputs that make the logarithm’s argument zero or negative, or draw the curve crossing its vertical asymptote. They may think a vertical shift changes the asymptote, or swap coordinates when using the related exponential function.
How to Assess It
- Give students y = log₂(x − 3) + 1. Ask them to sketch it and label the vertical asymptote, domain, range, x-intercept, and direction of change.
Lesson moves
Ways to Teach It
Use tracing paper to shift a graph of y = log₂x, then label the new asymptote, domain, range, and intercepts.
Ask students to explain why a logarithmic graph cannot include an input that makes its argument zero or negative.
Run a card match with logarithmic equations, tables, graphs, asymptotes, domains, and ranges, requiring students to justify each set.
Plot sound intensity and decibel level using L = 10log₁₀(I/I₀), then describe the graph’s domain and rate of change.
Free download
Printable MA.912.AR.5.8 Worksheet
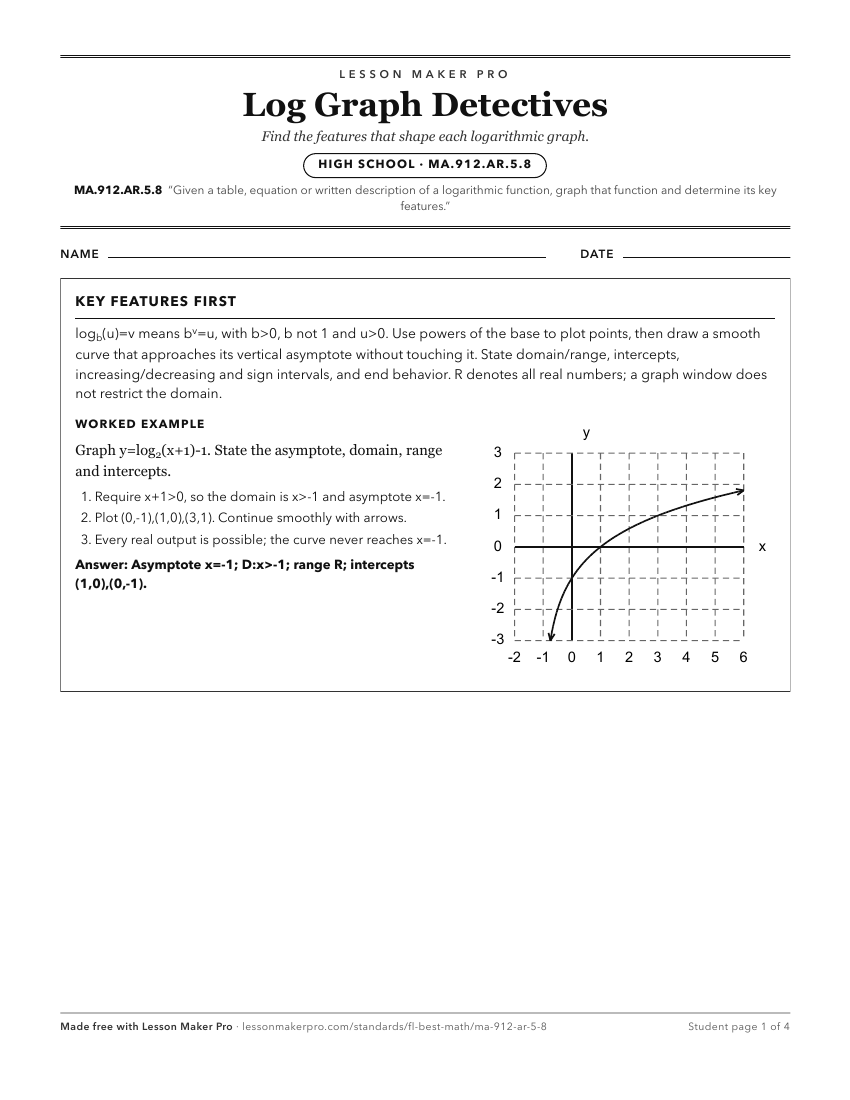
A ready-to-print activity worksheet aligned to MA.912.AR.5.8, with an answer key for the teacher on its own page. No account needed.
PDF, US Letter, prints cleanly in black and white.
Download the worksheetKeep exploring
Related Standards
- MA.912.AR.8.2
Given a table, equation or written description of a rational function, graph that function and determine its key features.
- MA.912.AR.5.6
Given a table, equation or written description of an exponential function, graph that function and determine its key features.
- MA.912.AR.4.3
Given a table, equation or written description of an absolute value function, graph that function and determine its key features.
- MA.912.AR.2.4
Given a table, equation or written description of a linear function, graph that function, and determine and interpret its key features.
Turn this exact standard into a lesson
Grade, subject, topic, and the complete standard are prefilled. Create one free, no account needed.
Also for this standard:Make a WorksheetMake a QuizMake a Sub Lesson