Florida B.E.S.T. MA.912.AR.3.7
The Standard
Given a table, equation or written description of a quadratic function, graph that function, and determine and interpret its key features.
Florida B.E.S.T. Standards for Mathematics
Teacher's field guide
What This Standard Means
What Students Need to Do
- Students turn tables, equations, and verbal situations into accurate parabola graphs. They identify the vertex, axis of symmetry, intercepts, maximum or minimum, domain, range, and intervals of increase or decrease. They explain what those features mean in context.
What Mastery Looks Like
- Students produce a correctly scaled parabola from any given representation. They label key features and use symmetry to check their graph. In context, they explain each feature with correct units and reasonable input values.
Common Misconceptions
- Students may confuse the vertex with the y-intercept or assume every parabola opens upward. They may read intercepts inaccurately, ignore symmetry, or report an unrestricted domain for a real situation. Some describe coordinates without explaining their meaning in context.
How to Assess It
- Give students h(t) = -2(t - 3)² + 18. Ask them to graph it, label its key features, and explain the vertex and intercepts in context.
Lesson moves
Ways to Teach It
Plot points from y = (x - 2)² - 4 on graph paper, fold along x = 2, and compare paired points to verify symmetry.
Show a projectile graph and ask, “What do the vertex and intercepts mean here, and which domain values make sense?”
Run a card match with tables, equations, graphs, and feature cards; teams justify each four-card set before scoring.
Model a tossed ball using video data, graph a quadratic fit, and interpret its peak height and landing time.
Free download
Printable MA.912.AR.3.7 Worksheet
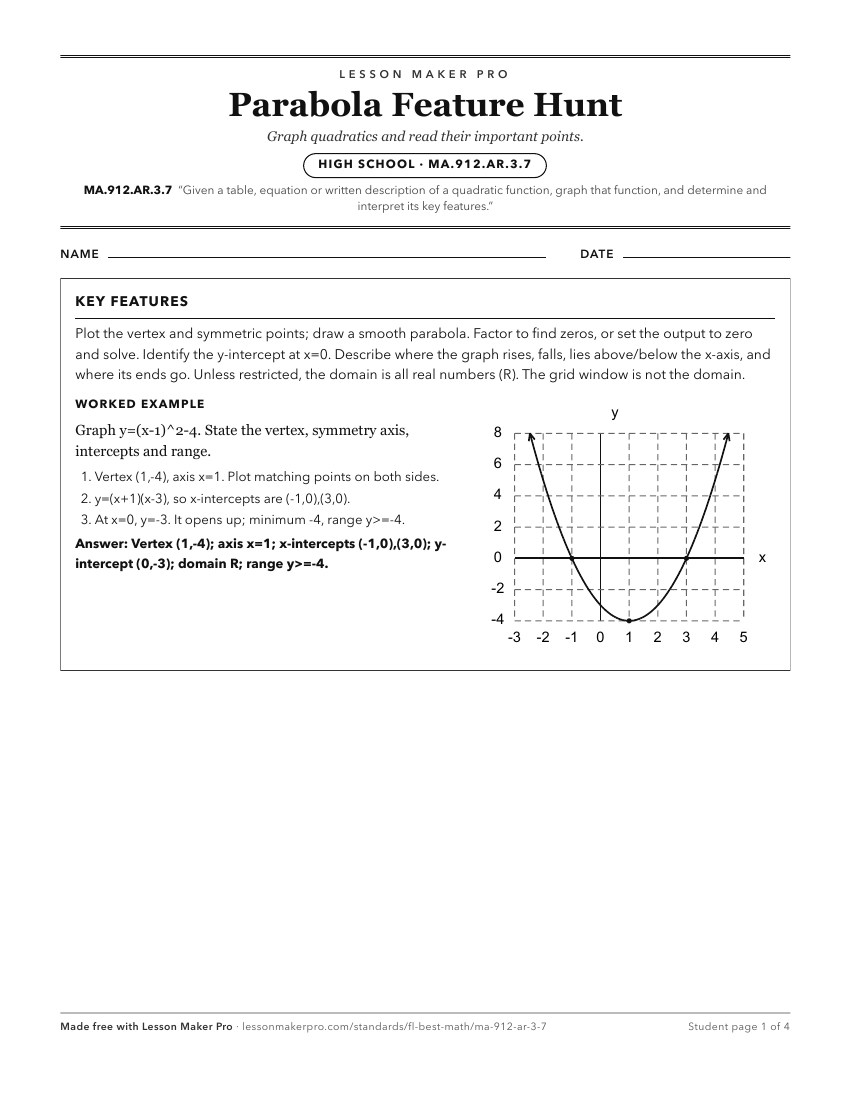
A ready-to-print activity worksheet aligned to MA.912.AR.3.7, with an answer key for the teacher on its own page. No account needed.
PDF, US Letter, prints cleanly in black and white.
Download the worksheetKeep exploring
Related Standards
- MA.912.AR.8.2
Given a table, equation or written description of a rational function, graph that function and determine its key features.
- MA.912.AR.5.6
Given a table, equation or written description of an exponential function, graph that function and determine its key features.
- MA.912.AR.4.3
Given a table, equation or written description of an absolute value function, graph that function and determine its key features.
- MA.912.AR.2.4
Given a table, equation or written description of a linear function, graph that function, and determine and interpret its key features.
Turn this exact standard into a lesson
Grade, subject, topic, and the complete standard are prefilled. Create one free, no account needed.
Also for this standard:Make a WorksheetMake a QuizMake a Sub Lesson