Florida B.E.S.T. MA.912.F.1.6
The Standard
Compare key features of linear and nonlinear functions each represented algebraically, graphically, in tables or written descriptions.
Florida B.E.S.T. Standards for Mathematics
Teacher's field guide
What This Standard Means
What Students Need to Do
- Students identify intercepts, rates of change, intervals of increase or decrease, and turning points from equations, graphs, tables, and descriptions. They decide whether each function is linear or nonlinear and support comparisons with evidence.
What Mastery Looks Like
- A student can find the same feature when two functions are shown in different forms. They can explain which changes faster, compare intercepts, and show why one has a constant rate while another does not.
Common Misconceptions
- Students often call any increasing graph linear or assume a table is linear because both columns rise. They may compare output values instead of rates, overlook unequal input intervals, or confuse the y-intercept with the slope.
How to Assess It
- On an exit ticket, compare y = 2x + 1 with the table x: 0, 1, 2, 3 and y: 0, 1, 4, 9. Identify which is linear, then compare their starting values and rates of change using two pieces of evidence.
Lesson moves
Ways to Teach It
Give pairs of equation, graph, table, and description cards; students match representations, then label intercepts, rates of change, and turning points.
Have students write how first differences show whether a table is linear, then compare evidence with a partner.
Play Function Face-Off, where pairs draw representation cards and earn a point by correctly comparing two named features.
Compare a taxi fare equation with a cooling-coffee graph, focusing on starting values, changing rates, and what each feature means.
Free download
Printable MA.912.F.1.6 Worksheet
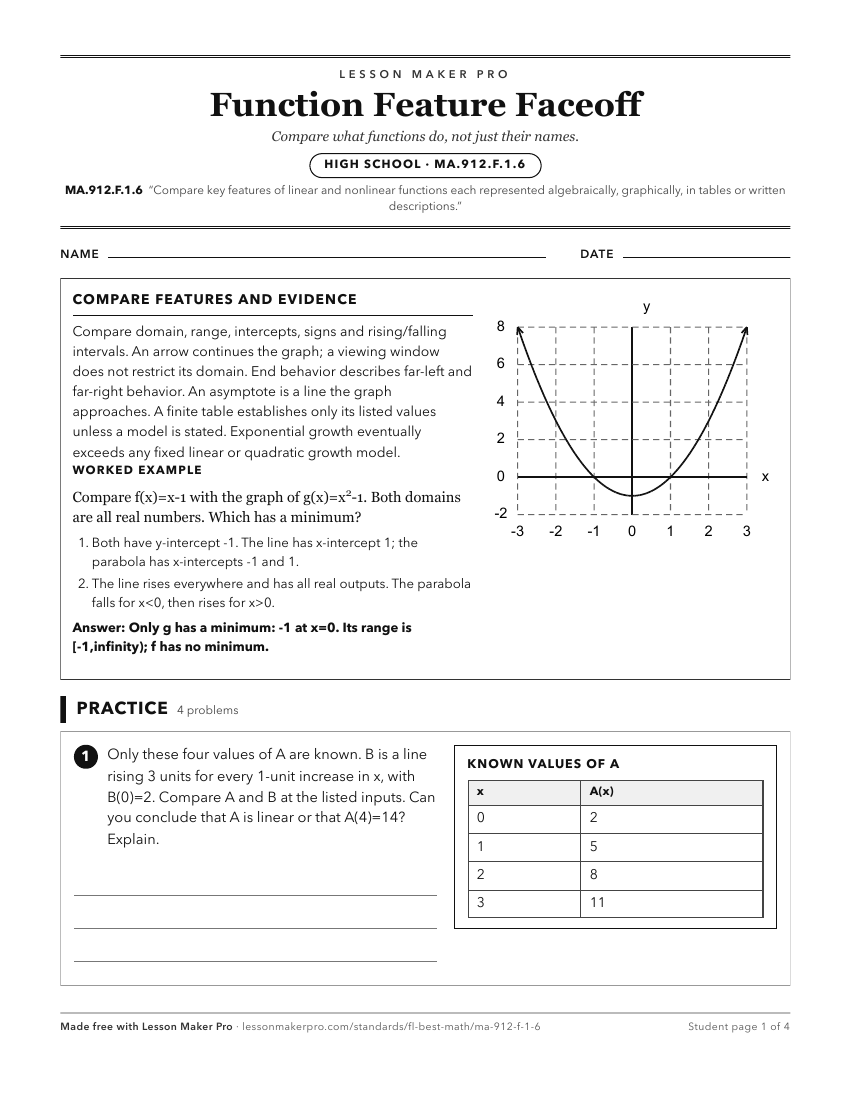
A ready-to-print activity worksheet aligned to MA.912.F.1.6, with an answer key for the teacher on its own page. No account needed.
PDF, US Letter, prints cleanly in black and white.
Download the worksheetKeep exploring
Related Standards
- MA.912.F.1.5
Compare key features of linear functions each represented algebraically, graphically, in tables or written descriptions.
- MA.912.F.1.7
Compare key features of two functions each represented algebraically, graphically, in tables or written descriptions.
- MA.912.AR.2.4
Given a table, equation or written description of a linear function, graph that function, and determine and interpret its key features.
- MA.912.AR.5.8
Given a table, equation or written description of a logarithmic function, graph that function and determine its key features.
Turn this exact standard into a lesson
Grade, subject, topic, and the complete standard are prefilled. Create one free, no account needed.
Also for this standard:Make a WorksheetMake a QuizMake a Sub Lesson