CCSS.
Standard Cluster
Analyze functions using different representations
Common Core State Standards for Mathematics · High School — Functions
Cluster contents
Standards in This Cluster
CCSS.Math.Content.HSF-IF.C is a cluster heading. These are the individual standards under it.
- CCSS.Math.Content.HSF-IF.C.7
Graph functions expressed symbolically and show key features of the graph, by hand in simple cases and using technology for more complicated cases.
- CCSS.Math.Content.HSF-IF.C.7a
Graph linear and quadratic functions and show intercepts, maxima, and minima.
- CCSS.Math.Content.HSF-IF.C.7b
Graph square root, cube root, and piecewise-defined functions, including step functions and absolute value functions.
- CCSS.Math.Content.HSF-IF.C.7c
Graph polynomial functions, identifying zeros when suitable factorizations are available, and showing end behavior.
- CCSS.Math.Content.HSF-IF.C.7d
(+) Graph rational functions, identifying zeros and asymptotes when suitable factorizations are available, and showing end behavior.
- CCSS.Math.Content.HSF-IF.C.7e
Graph exponential and logarithmic functions, showing intercepts and end behavior, and trigonometric functions, showing period, midline, and amplitude.
- CCSS.Math.Content.HSF-IF.C.8
Write a function defined by an expression in different but equivalent forms to reveal and explain different properties of the function.
- CCSS.Math.Content.HSF-IF.C.8a
Use the process of factoring and completing the square in a quadratic function to show zeros, extreme values, and symmetry of the graph, and interpret these in ...
- CCSS.Math.Content.HSF-IF.C.8b
Use the properties of exponents to interpret expressions for exponential functions.
- CCSS.Math.Content.HSF-IF.C.9
Compare properties of two functions each represented in a different way (algebraically, graphically, numerically in tables, or by verbal descriptions).
Teacher's field guide
What This Cluster Means
What Students Need to Do
- Students read key features of functions from equations, tables, graphs, and written situations. They connect equivalent representations and compare functions using intercepts, rates of change, extrema, and end behavior.
What Mastery Looks Like
- Students identify intercepts, increasing and decreasing intervals, extrema, and rates of change from graphs, tables, equations, or descriptions. They compare two functions and support conclusions with values or graph features.
Common Misconceptions
- Students may treat f(x) as multiplication or confuse inputs with outputs. They may ignore graph scales, connect discrete data as continuous, or compare functions at different input values.
How to Assess It
- Exit ticket: Function A has values A(0) = 2 and A(4) = 10. Function B is B(x) = 3x + 1. Which has the greater average rate of change from 0 to 4? Show your work.
Lesson moves
Ways to Teach It
Give groups equation, table, graph, and description cards to match, then require one written reason for each set.
Ask students which representation best shows intercepts, rate of change, or maximum values, and have them defend each choice.
Play Function Match by displaying one representation while teams sketch or write a matching second representation on whiteboards.
Use hourly temperature data to make a graph, identify increasing and decreasing intervals, and calculate average rates of change.
Free download
Printable HSF-IF.C Worksheet
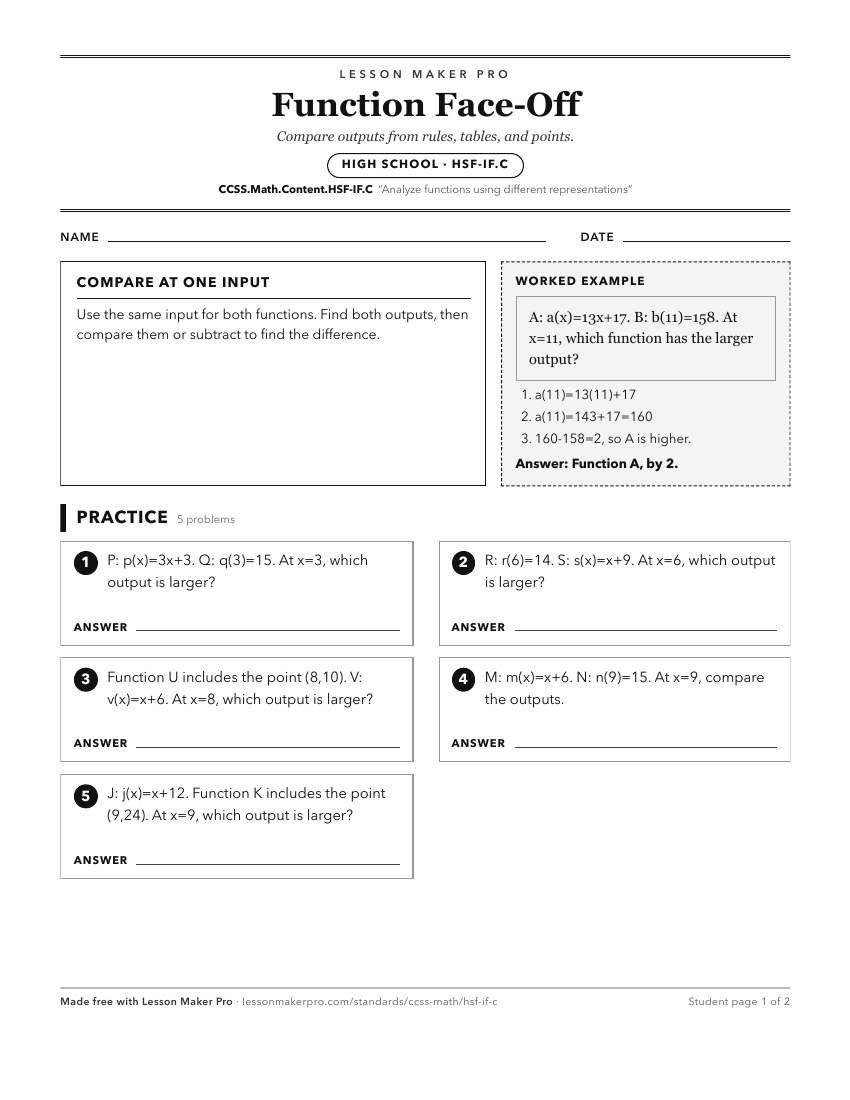
A ready-to-print activity worksheet aligned to CCSS.Math.Content.HSF-IF.C, with an answer key for the teacher on its own page. No account needed.
PDF, US Letter, prints cleanly in black and white.
Download the worksheetKeep exploring
Related Standards
Turn this cluster into a lesson
Grade, subject, topic, and the complete cluster are prefilled. Create one free, no account needed.
Also for this cluster:Make a WorksheetMake a QuizMake a Sub Lesson