Texas TEKS 6.2
TEKS Knowledge Statement (Expectation Cluster)
Scientific and engineering practices. The student analyzes and interprets data to derive meaning, identify features and patterns, and discover relationships or correlations to develop evidence-based arguments or evaluate designs. The student is expected to: identify advantages and limitations of models such as their size, scale, properties, and materials; analyze data by identifying any significant descriptive statistical features, patterns, sources of error, or limitations; use mathematical calculations to assess quantitative relationships in data; and evaluate experimental and engineering designs.
Texas Essential Knowledge and Skills for Science
Cluster contents
Student Expectations in This Statement
6.2 is a TEKS knowledge and skills statement. These are the student expectations under it.
- 6.2.A
identify advantages and limitations of models such as their size, scale, properties, and materials
- 6.2.B
analyze data by identifying any significant descriptive statistical features, patterns, sources of error, or limitations
- 6.2.C
use mathematical calculations to assess quantitative relationships in data
- 6.2.D
evaluate experimental and engineering designs.
Teacher's field guide
What This Cluster Means
What Students Need to Do
- Students judge how a model’s size, scale, properties, and materials affect what it can show. They find patterns, unusual values, errors, and limits in data. They use calculations to compare results and decide whether an experiment or design works well.
What Mastery Looks Like
- Students can name a useful feature and a limitation of a model. They calculate values such as mean, range, difference, or ratio and use them to explain a pattern. They support a design decision with data and suggest a specific improvement.
Common Misconceptions
- Students may treat a model as an exact copy or assume a larger model is always better. They may ignore outliers, claim that correlation proves cause, or remove inconvenient results. They may judge a design by appearance rather than test data.
How to Assess It
- Exit ticket: A bridge model holds 8, 10, 10, and 22 washers across four trials. Find the mean and range, identify a possible error, name one model limitation, and recommend whether to retest or redesign.
Lesson moves
Ways to Teach It
Build two foil boat models, test their washer capacity, calculate mean loads, and identify how material or size limits each model.
Show a scatterplot and ask students to write one observed relationship, one unsupported claim, and one possible source of error.
Give teams cards showing patterns, correlations, outliers, errors, and design limits, then race to sort and justify each card.
Compare forecast temperatures with recorded temperatures, calculate each difference, and recommend one way to improve the weather model.
Free download
Printable 6.2 Worksheet
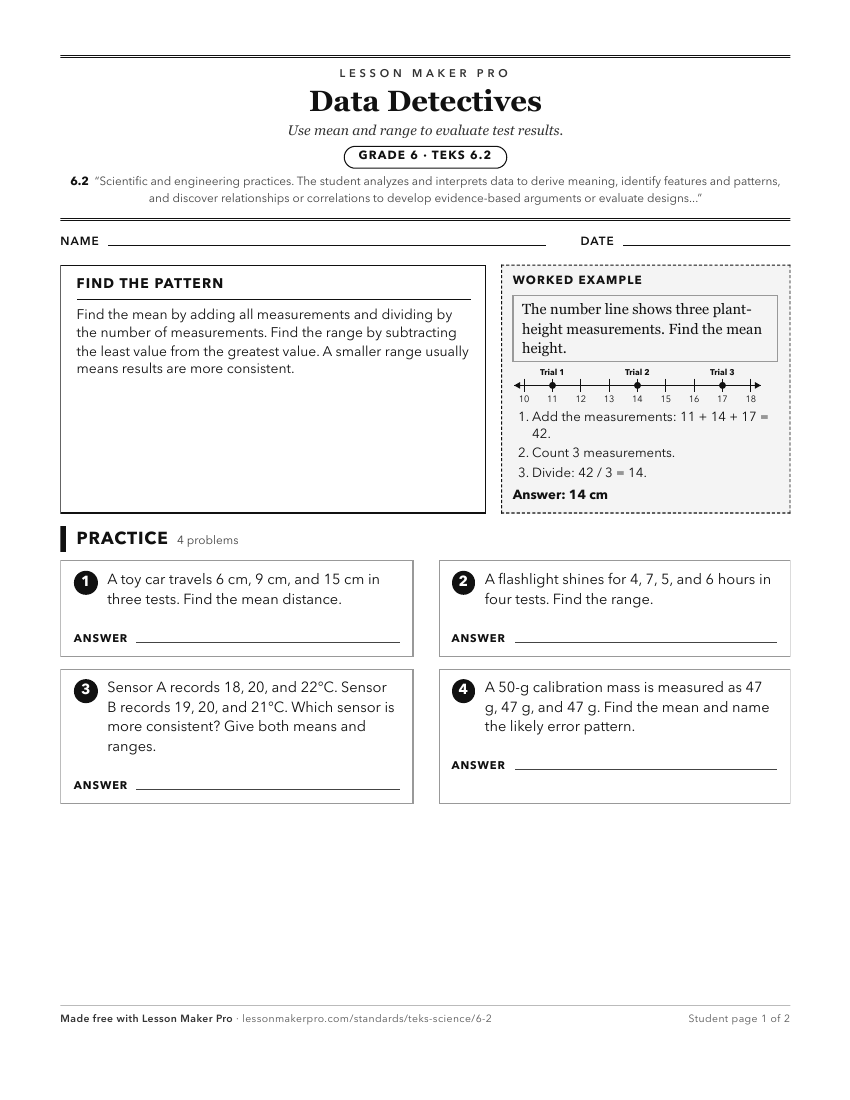
A ready-to-print activity worksheet aligned to 6.2, with an answer key for the teacher on its own page. No account needed.
PDF, US Letter, prints cleanly in black and white.
Download the worksheetKeep exploring
Related Standards
Turn this cluster into a lesson
Grade, subject, topic, and the complete cluster are prefilled. Create one free, no account needed.
Also for this cluster:Make a WorksheetMake a QuizMake a Sub Lesson