TEKS Math 8.5
Knowledge and Skills Statement (Standard Cluster)
The student applies mathematical process standards to use proportional and non-proportional relationships to develop foundational concepts of functions
Texas Essential Knowledge and Skills for Mathematics
Cluster contents
Student Expectations in This Statement
8.5 is a knowledge and skills statement. These are the student expectations under it.
- 8.5.A
represent linear proportional situations with tables, graphs, and equations in the form of y = kx
- 8.5.B
represent linear non-proportional situations with tables, graphs, and equations in the form of y = mx + b, where b ≠ 0
- 8.5.C
contrast bivariate sets of data that suggest a linear relationship with bivariate sets of data that do not suggest a linear relationship from a graphical repres...
- 8.5.D
use a trend line that approximates the linear relationship between bivariate sets of data to make predictions
- 8.5.E
solve problems involving direct variation
- 8.5.F
distinguish between proportional and non-proportional situations using tables, graphs, and equations in the form y = kx or y = mx + b, where b ≠ 0
- 8.5.G
identify functions using sets of ordered pairs, tables, mappings, and graphs
- 8.5.H
identify examples of proportional and non-proportional functions that arise from mathematical and real-world problems
- 8.5.I
write an equation in the form y = mx + b to model a linear relationship between two quantities using verbal, numerical, tabular, and graphical representations
Teacher's field guide
What This Cluster Means
What Students Need to Do
- Students decide whether a relationship is a function and whether it is proportional, nonproportional linear, or nonlinear. They connect situations, ordered pairs, tables, mappings, graphs, and equations. They write linear models and use direct variation or trend lines to predict values.
What Mastery Looks Like
- Given any representation, students identify the relationship type and justify it using constant ratio, constant rate of change, intercept, or function rules. They calculate slope and intercept, write a matching equation, and make a reasonable prediction from it or from a trend line.
Common Misconceptions
- Students often call every straight line proportional, even when the graph does not pass through the origin. They may swap slope and intercept, expect every point to lie on a trend line, or accept repeated inputs with different outputs as a function.
How to Assess It
- Exit ticket: For x = 0, 2, 4 and y = 3, 7, 11, ask students to classify the relationship, write its equation, identify whether it is a function, and predict y when x = 10. Require one sentence explaining why it is not proportional.
Lesson moves
Ways to Teach It
Give students cards with tables, graphs, equations, and situations, then have them sort and match proportional, nonproportional linear, nonlinear, and nonfunction examples.
Ask students to compare two scatter plots and explain which supports a linear model, citing pattern, slope, intercept, and outliers.
Run a matching relay where teams pair representation cards, write each equation, and label each relation proportional, nonproportional, nonlinear, or not a function.
Use taxi starting fees and per mile charges to build a table, graph the data, write a model, and predict a fare.
Free download
Printable 8.5 Worksheet
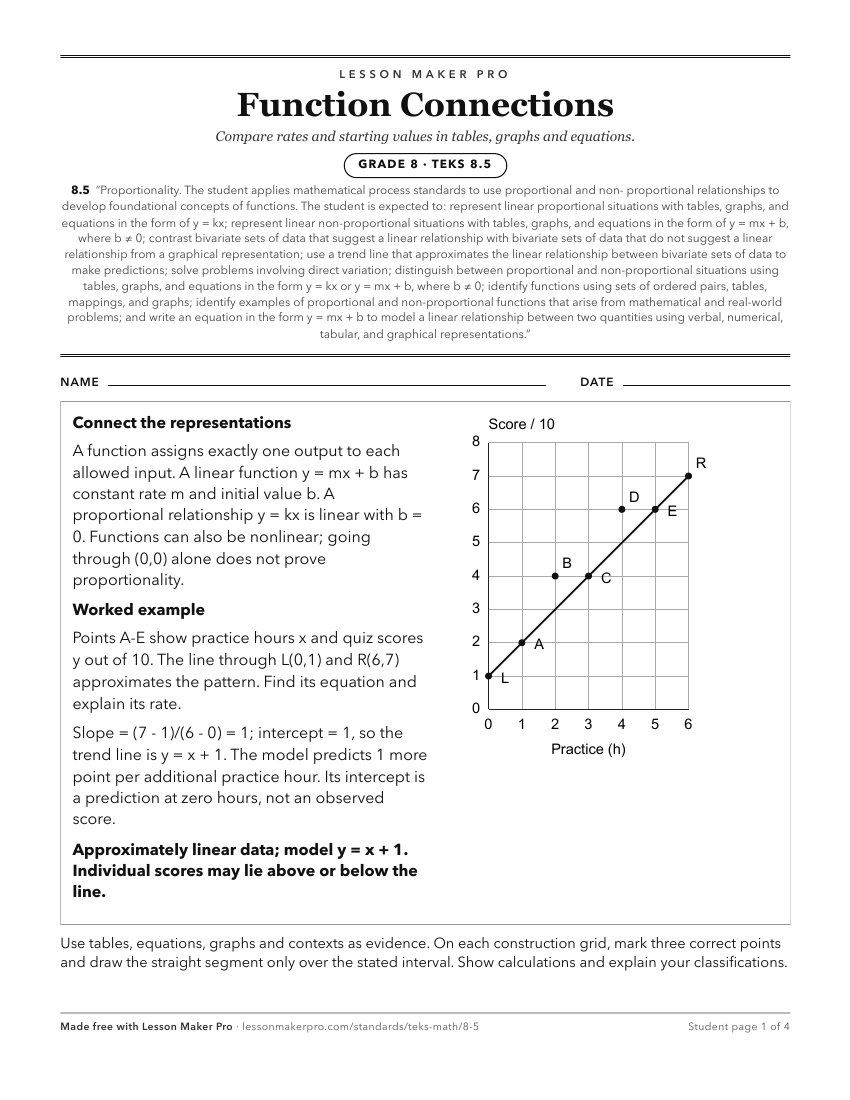
A ready-to-print activity worksheet aligned to 8.5, with an answer key for the teacher on its own page. No account needed.
PDF, US Letter, prints cleanly in black and white.
Download the worksheetKeep exploring
Related Standards
- 7.4
The student applies mathematical process standards to represent and solve problems involving proportional relationships
- 7.5
The student applies mathematical process standards to use geometry to describe or solve problems involving proportional relationships
- 6.5
The student applies mathematical process standards to solve problems involving proportional relationships
- 6.4
The student applies mathematical process standards to develop an understanding of proportional relationships in problem situations
Turn this cluster into a lesson
Grade, subject, topic, and the complete cluster are prefilled. Create one free, no account needed.
Also for this cluster:Make a WorksheetMake a QuizMake a Sub Lesson