TEKS Math 8.5.D
The Standard
use a trend line that approximates the linear relationship between bivariate sets of data to make predictions
Texas Essential Knowledge and Skills for Mathematics
Teacher's field guide
What This Standard Means
What Students Need to Do
- Students read the overall direction in a scatter plot and use a reasonable straight line to estimate one variable from the other. They make estimates inside and outside the observed data range, then describe why some predictions are less reliable.
What Mastery Looks Like
- A student places a reasonable line through the center of a roughly linear scatter plot, with points balanced above and below. The student reads estimated values from the line and explains why estimates within the data range are usually more reliable.
Common Misconceptions
- Students may connect individual points instead of following the overall pattern. They may force the line through the origin or expect every estimate to be exact. They may trust estimates far outside the data range or assume one variable causes the other.
How to Assess It
- Give students a scatter plot with a drawn trend line. Ask, "Estimate y when x = 7 and x = 14. Which estimate is more reliable, and why?"
Lesson moves
Ways to Teach It
Plot class hand-span and height data on sticky notes, place a string trend line, then predict height for a new hand span.
Write: Which prediction is more trustworthy, one inside the data range or one far outside it, and why?
Play Prediction Match: teams pair input cards with estimated output cards by reading several scatter plots and their trend lines.
Use a trend line from temperature and electricity-use data to estimate household demand on a hotter day.
Free download
Printable 8.5.D Worksheet
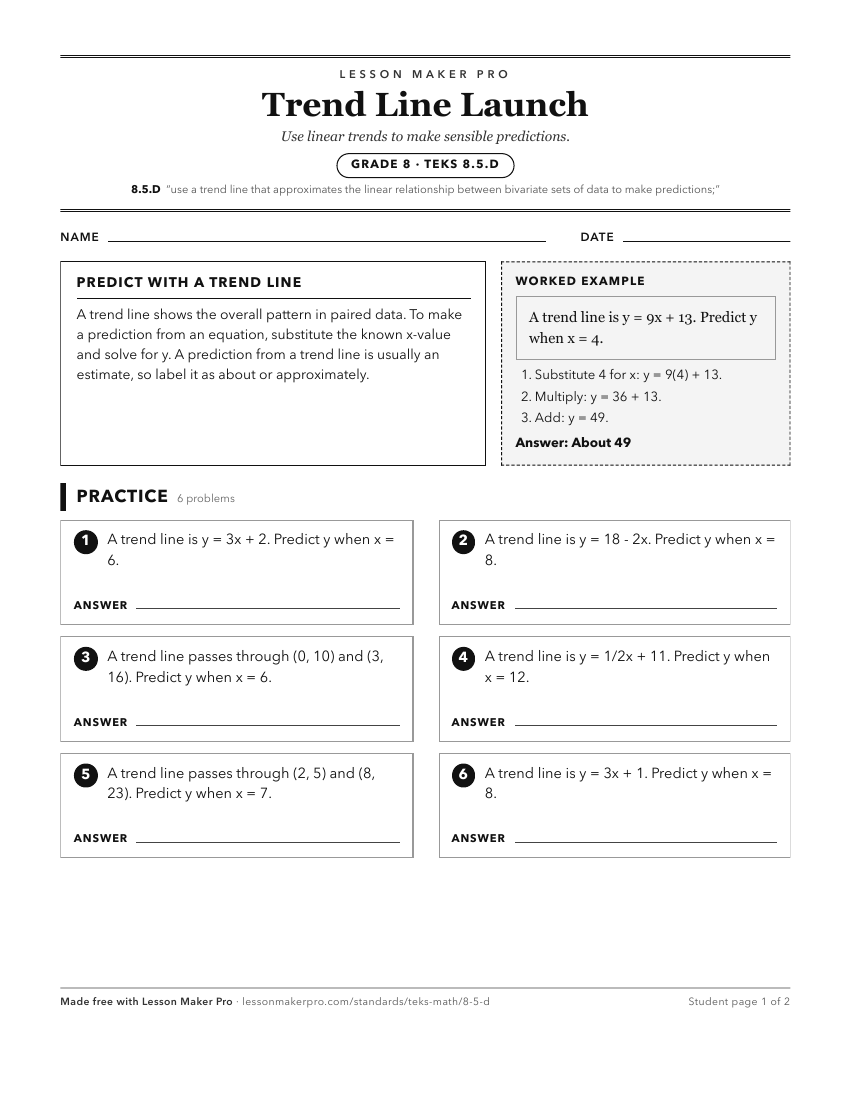
A ready-to-print activity worksheet aligned to 8.5.D, with an answer key for the teacher on its own page. No account needed.
PDF, US Letter, prints cleanly in black and white.
Download the worksheetKeep exploring
Related Standards
- 8.5.C
contrast bivariate sets of data that suggest a linear relationship with bivariate sets of data that do not suggest a linear relationship from a graphical repres...
- 2.10.D
draw conclusions and make predictions from information in a graph
- 8.5.I
write an equation in the form y = mx + b to model a linear relationship between two quantities using verbal, numerical, tabular, and graphical representations
- 8.11.A
construct a scatterplot and describe the observed data to address questions of association such as linear, non-linear, and no association between bivariate data
Turn this exact standard into a lesson
Grade, subject, topic, and the complete standard are prefilled. Create one free, no account needed.
Also for this standard:Make a WorksheetMake a QuizMake a Sub Lesson