TEKS Math 8.5.C
The Standard
contrast bivariate sets of data that suggest a linear relationship with bivariate sets of data that do not suggest a linear relationship from a graphical representation
Texas Essential Knowledge and Skills for Mathematics
Teacher's field guide
What This Standard Means
What Students Need to Do
- Students examine scatter plots and decide whether the points suggest a straight-line pattern. They compare linear patterns with curved, clustered, or random patterns.
What Mastery Looks Like
- Students correctly identify scatter plots that cluster around a straight line. They distinguish these from curved patterns, clusters, and plots with no clear relationship.
Common Misconceptions
- Students may call any upward or downward pattern linear, even when the points form a curve. They may also mistake scattered points or one outlier for a linear relationship.
How to Assess It
- Give students four unlabeled scatter plots. Ask them to sort each as linear or not linear and justify one choice using the overall pattern.
Lesson moves
Ways to Teach It
Create a human scatter plot on taped floor axes, then ask students whether their positions follow an imagined straight line.
Show two scatter plots and ask, "Which suggests a linear relationship, and what visible evidence supports your choice?"
Give pairs cards with scatter plots to sort into linear and not linear piles, then compare and defend their sorting decisions.
Graph temperature and ice cream sales beside time and plant growth, then compare which relationship appears linear over the measured interval.
Free download
Printable 8.5.C Worksheet
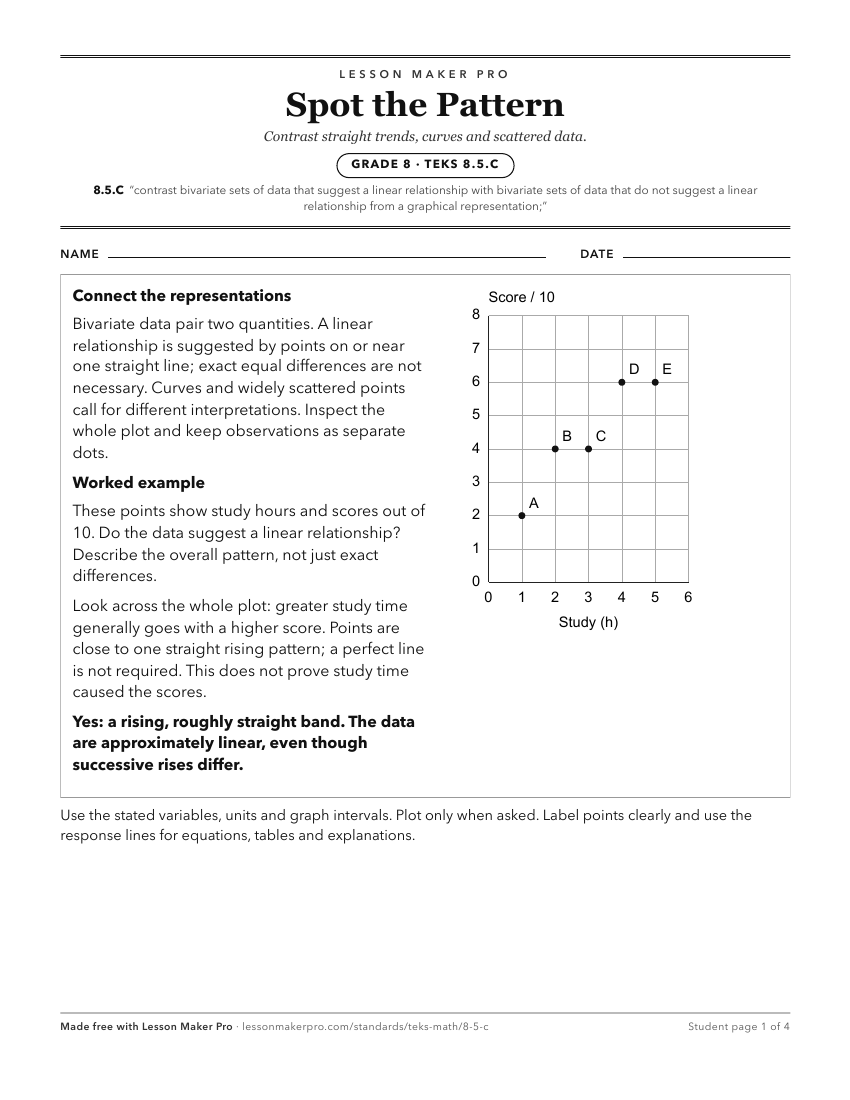
A ready-to-print activity worksheet aligned to 8.5.C, with an answer key for the teacher on its own page. No account needed.
PDF, US Letter, prints cleanly in black and white.
Download the worksheetKeep exploring
Related Standards
- 8.5.B
represent linear non-proportional situations with tables, graphs, and equations in the form of y = mx + b, where b ≠ 0
- 8.5.D
use a trend line that approximates the linear relationship between bivariate sets of data to make predictions
- 5.9.B
represent discrete paired data on a scatterplot
- 8.11.A
construct a scatterplot and describe the observed data to address questions of association such as linear, non-linear, and no association between bivariate data
Turn this exact standard into a lesson
Grade, subject, topic, and the complete standard are prefilled. Create one free, no account needed.
Also for this standard:Make a WorksheetMake a QuizMake a Sub Lesson