TEKS Math 5.9.B
The Standard
represent discrete paired data on a scatterplot
Texas Essential Knowledge and Skills for Mathematics
Teacher's field guide
What This Standard Means
What Students Need to Do
- Students organize two related sets of counts as ordered pairs. They choose and label suitable scales, then plot one point for each pair on a coordinate grid.
What Mastery Looks Like
- Given a data table, students place each pair correctly on a coordinate grid. Their axes are labeled, scales use equal intervals, and points are not connected.
Common Misconceptions
- Students may switch the two values and plot them on the wrong axes. They may use uneven scale intervals or leave axes unlabeled. Some connect the points as if making a line graph.
How to Assess It
- Exit ticket: Give the pairs (4, 3), (6, 5), (8, 6), and (10, 7). Ask students to make a scatterplot with labeled axes and equal scale intervals.
Lesson moves
Ways to Teach It
Survey classmates about numbers of siblings and pets, then place sticky dots for each pair on a large coordinate grid.
Show a scatterplot with switched axes and uneven intervals, then ask students to identify and correct each error in writing.
Play a scatterplot relay where teams draw data cards, plot one point, and check the previous team's point.
Use library data showing each student's visits and books checked out, then create a scatterplot of the two counts.
Free download
Printable 5.9.B Worksheet
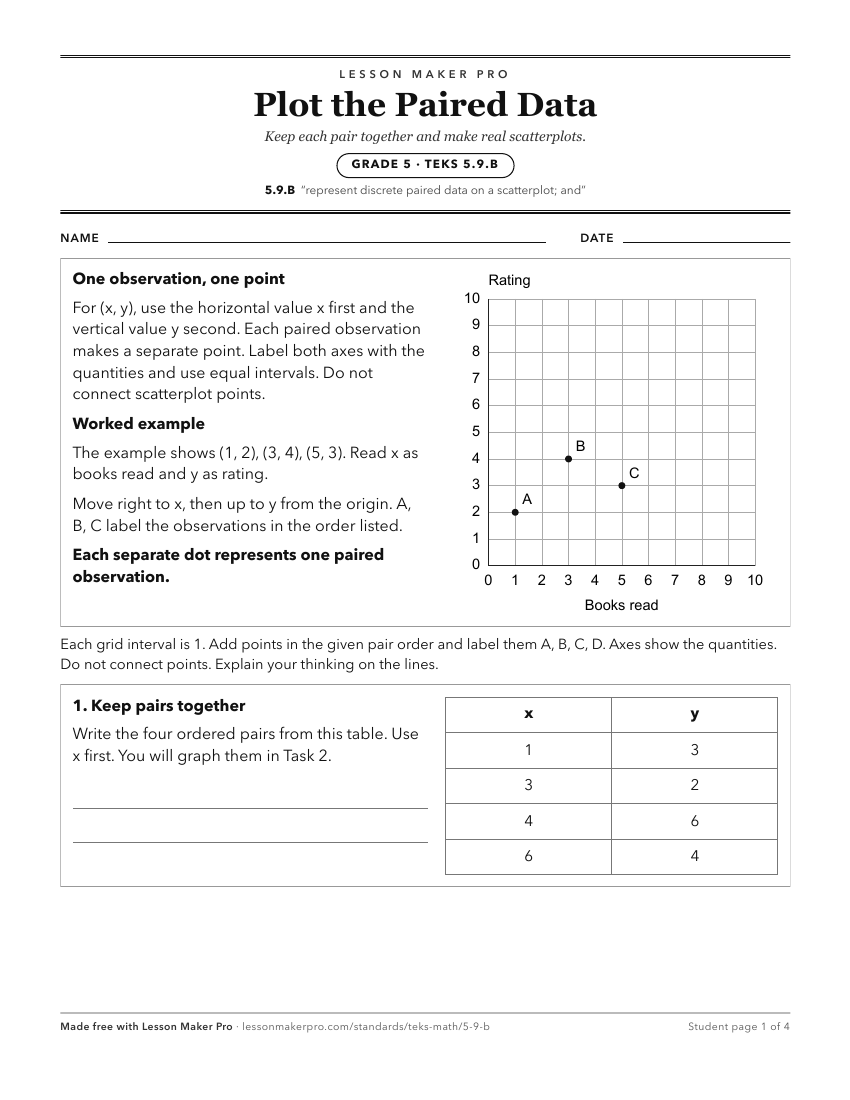
A ready-to-print activity worksheet aligned to 5.9.B, with an answer key for the teacher on its own page. No account needed.
PDF, US Letter, prints cleanly in black and white.
Download the worksheetKeep exploring
Related Standards
- 5.9.A
represent categorical data with bar graphs or frequency tables and numerical data, including data sets of measurements in fractions or decimals, with dot plots ...
- 6.12.A
represent numeric data graphically, including dot plots, stem-and-leaf plots, histograms, and box plots
- 8.5.C
contrast bivariate sets of data that suggest a linear relationship with bivariate sets of data that do not suggest a linear relationship from a graphical repres...
- 8.11.A
construct a scatterplot and describe the observed data to address questions of association such as linear, non-linear, and no association between bivariate data
Turn this exact standard into a lesson
Grade, subject, topic, and the complete standard are prefilled. Create one free, no account needed.
Also for this standard:Make a WorksheetMake a QuizMake a Sub Lesson