TEKS Math 8.11.A
The Standard
construct a scatterplot and describe the observed data to address questions of association such as linear, non-linear, and no association between bivariate data
Texas Essential Knowledge and Skills for Mathematics
Teacher's field guide
What This Standard Means
What Students Need to Do
- Students plot paired numerical data on a coordinate plane with one variable on each axis. They describe the pattern as linear, nonlinear, or absent and use it to answer questions about association.
What Mastery Looks Like
- Students choose sensible scales, label both axes, and plot ordered pairs accurately. They identify linear, curved, or absent patterns and describe the direction and strength when appropriate.
Common Misconceptions
- Students may plot each variable separately instead of keeping each data pair together. They may call any upward pattern linear, even when the points follow a curve. They may also claim that association proves one variable causes the other.
How to Assess It
- Give students eight paired values and ask them to make a labeled scatterplot. Have them classify the pattern and support their answer with one observation from the graph.
Lesson moves
Ways to Teach It
Have pairs measure classmates’ heights and arm spans, plot the class data, and describe the pattern they see.
Show three scatterplots and ask students to write which graph best supports a prediction, using visible evidence.
Give groups scatterplot cards to sort into positive linear, negative linear, nonlinear, and no association, then compare choices.
Plot daily temperature and electricity use from a sample month, then discuss what the association suggests and what it cannot prove.
Free download
Printable 8.11.A Worksheet
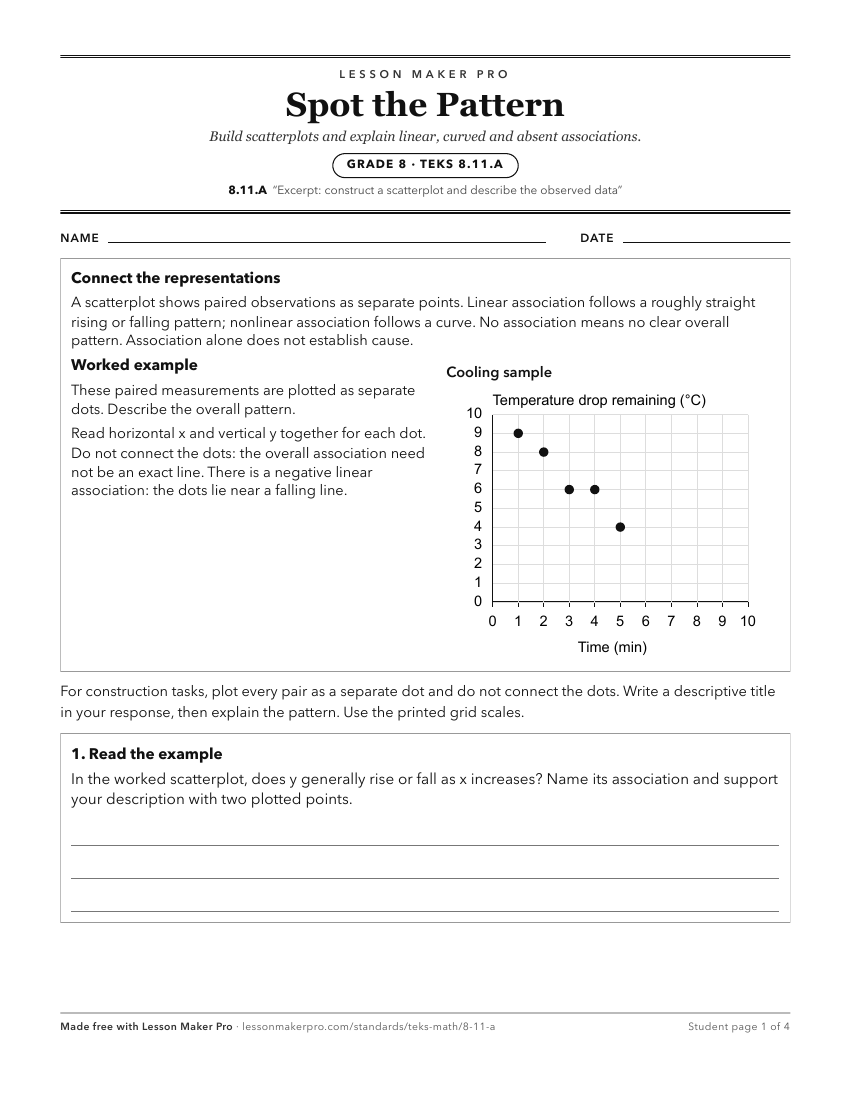
A ready-to-print activity worksheet aligned to 8.11.A, with an answer key for the teacher on its own page. No account needed.
PDF, US Letter, prints cleanly in black and white.
Download the worksheetKeep exploring
Related Standards
- 5.9.C
solve one- and two-step problems using data from a frequency table, dot plot, bar graph, stem-and-leaf plot, or scatterplot
- 8.5.D
use a trend line that approximates the linear relationship between bivariate sets of data to make predictions
- 8.5.C
contrast bivariate sets of data that suggest a linear relationship with bivariate sets of data that do not suggest a linear relationship from a graphical repres...
- 5.9.B
represent discrete paired data on a scatterplot
Turn this exact standard into a lesson
Grade, subject, topic, and the complete standard are prefilled. Create one free, no account needed.
Also for this standard:Make a WorksheetMake a QuizMake a Sub Lesson